Return on Investment In Turkey
We are providing a financial metric for real estate investors as it helps them to determine the profitability of their real estate investment in Turkey
138$
Average Income
92$ - 185$
Min Income - Max Income
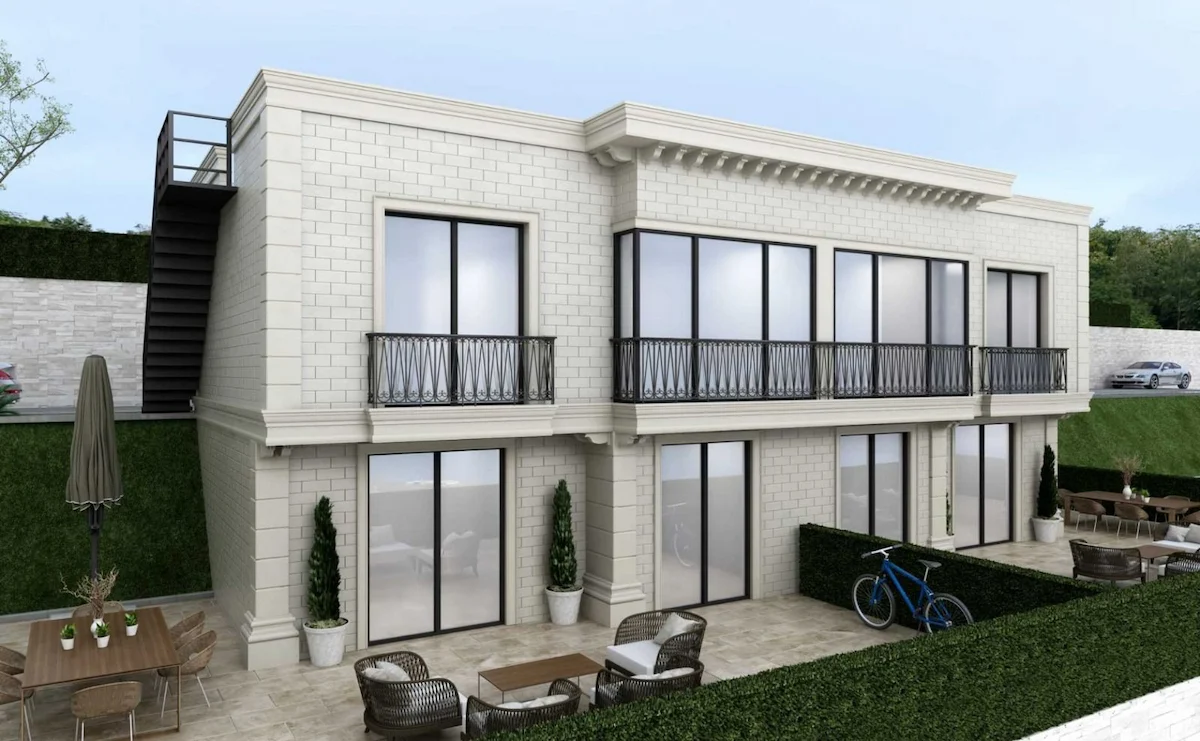
156,000$
Cash Price
| Year | Annual Increase | Monthly ROI | Annual ROI |
|---|---|---|---|
| 1 | 1.06 % | 138$ | 1,661$ |
| 2 | 1.33 % | 173$ | 2,076$ |
| 3 | 1.66 % | 216$ | 2,596$ |
| 4 | 2.08 % | 270$ | 3,244$ |
| 5 | 2.60 % | 338$ | 4,055$ |
| 6 | 3.25 % | 422$ | 5,069$ |
| 7 | 4.06 % | 528$ | 6,337$ |
| 8 | 5.08 % | 660$ | 7,921$ |
| 9 | 6.35 % | 825$ | 9,901$ |
| 10 | 7.93 % | 1,031$ | 12,376$ |
55,237$ 35%
Total ROI For 10 Years
185$
Max Income
156,000$
Cash Price
| Year | Annual Increase | Monthly ROI | Annual ROI |
|---|---|---|---|
| 1 | 1.42 % | 185$ | 2,215$ |
| 2 | 1.77 % | 231$ | 2,769$ |
| 3 | 2.22 % | 288$ | 3,461$ |
| 4 | 2.77 % | 360$ | 4,326$ |
| 5 | 3.47 % | 451$ | 5,407$ |
| 6 | 4.33 % | 563$ | 6,759$ |
| 7 | 5.42 % | 704$ | 8,449$ |
| 8 | 6.77 % | 880$ | 10,561$ |
| 9 | 8.46 % | 1,100$ | 13,201$ |
| 10 | 10.58 % | 1,375$ | 16,502$ |
73,650$ 47%
Total ROI For 10 Years
92$
Min Income
156,000$
Cash Price
| Year | Annual Increase | Monthly ROI | Annual ROI |
|---|---|---|---|
| 1 | 0.71 % | 92$ | 1,107$ |
| 2 | 0.89 % | 115$ | 1,384$ |
| 3 | 1.11 % | 144$ | 1,730$ |
| 4 | 1.39 % | 180$ | 2,163$ |
| 5 | 1.73 % | 225$ | 2,704$ |
| 6 | 2.17 % | 282$ | 3,380$ |
| 7 | 2.71 % | 352$ | 4,224$ |
| 8 | 3.38 % | 440$ | 5,281$ |
| 9 | 4.23 % | 550$ | 6,601$ |
| 10 | 5.29 % | 688$ | 8,251$ |
36,825$ 23%
Total ROI For 10 Years
District Classification
Rating
B+
Area map
Statistics
Population
44,001
Social Status
Married : 62%
Unmarried : 27%
area
138 Km2
Price Changes Over Last 5 Years
1 Year Change
10.99%
3 Year Change
420.1%
5 Year Change
462.4%
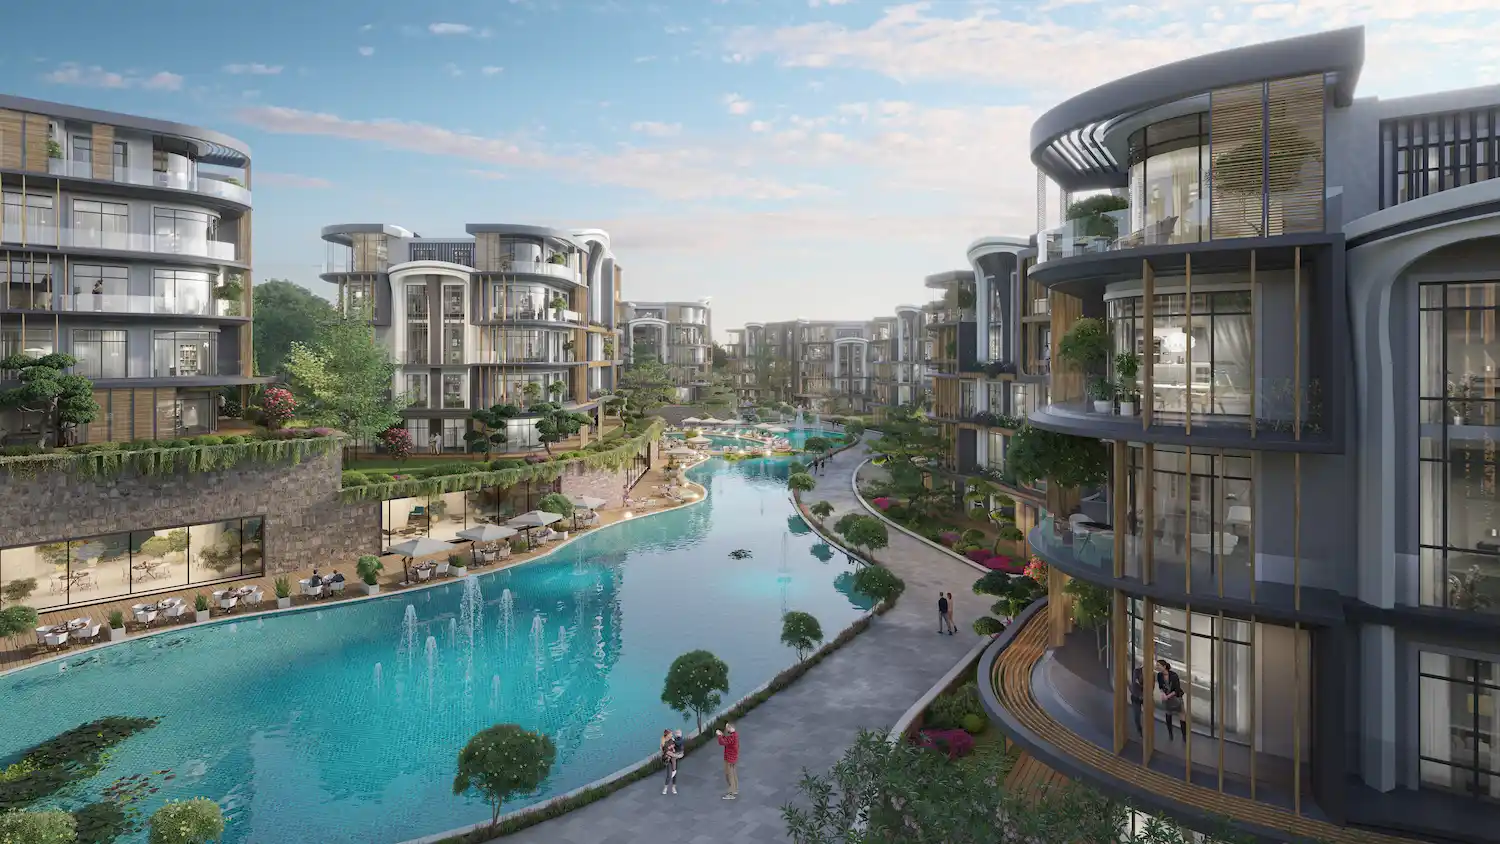
Projects Have same ROI in This Area


Have Question Or Suggestion ?
Please Share Your Thought, To Make It Real


