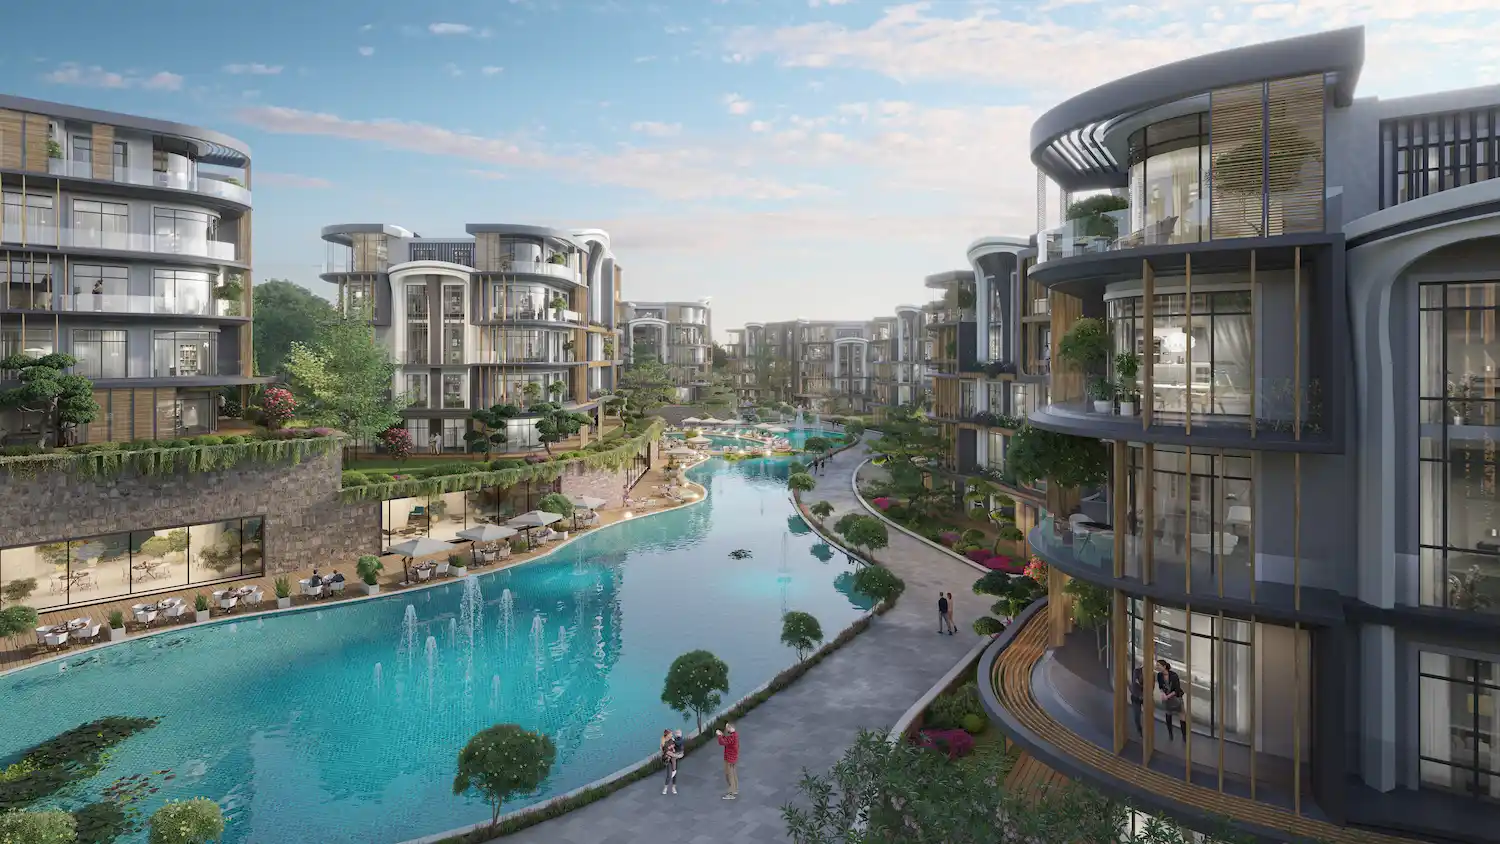
Return on Investment In Turkey
We are providing a financial metric for real estate investors as it helps them to determine the profitability of their real estate investment in Turkey
513د.إ
Average Income
342د.إ - 684د.إ
Min Income - Max Income
572,973د.إ
Cash Price
| Year | Annual Increase | Monthly ROI | Annual ROI |
|---|---|---|---|
| 1 | 1.07 % | 513د.إ | 6,151د.إ |
| 2 | 1.34 % | 641د.إ | 7,689د.إ |
| 3 | 1.68 % | 801د.إ | 9,612د.إ |
| 4 | 2.10 % | 1,001د.إ | 12,015د.إ |
| 5 | 2.62 % | 1,252د.إ | 15,018د.إ |
| 6 | 3.28 % | 1,564د.إ | 18,773د.إ |
| 7 | 4.10 % | 1,956د.إ | 23,466د.إ |
| 8 | 5.12 % | 2,444د.إ | 29,332د.إ |
| 9 | 6.40 % | 3,055د.إ | 36,666د.إ |
| 10 | 8.00 % | 3,819د.إ | 45,832د.إ |
204,554د.إ 35%
Total ROI For 10 Years
684د.إ
Max Income
572,973د.إ
Cash Price
| Year | Annual Increase | Monthly ROI | Annual ROI |
|---|---|---|---|
| 1 | 1.43 % | 684د.إ | 8,202د.إ |
| 2 | 1.79 % | 854د.إ | 10,252د.إ |
| 3 | 2.24 % | 1,068د.إ | 12,816د.إ |
| 4 | 2.80 % | 1,335د.إ | 16,019د.إ |
| 5 | 3.49 % | 1,669د.إ | 20,024د.إ |
| 6 | 4.37 % | 2,086د.إ | 25,030د.إ |
| 7 | 5.46 % | 2,607د.إ | 31,288د.إ |
| 8 | 6.83 % | 3,259د.إ | 39,110د.إ |
| 9 | 8.53 % | 4,074د.إ | 48,887د.إ |
| 10 | 10.67 % | 5,092د.إ | 61,109د.إ |
272,739د.إ 47%
Total ROI For 10 Years
342د.إ
Min Income
572,973د.إ
Cash Price
| Year | Annual Increase | Monthly ROI | Annual ROI |
|---|---|---|---|
| 1 | 0.72 % | 342د.إ | 4,101د.إ |
| 2 | 0.89 % | 427د.إ | 5,126د.إ |
| 3 | 1.12 % | 534د.إ | 6,408د.إ |
| 4 | 1.40 % | 667د.إ | 8,010د.إ |
| 5 | 1.75 % | 834د.إ | 10,012د.إ |
| 6 | 2.18 % | 1,043د.إ | 12,515د.إ |
| 7 | 2.73 % | 1,304د.إ | 15,644د.إ |
| 8 | 3.41 % | 1,630د.إ | 19,555د.إ |
| 9 | 4.27 % | 2,037د.إ | 24,444د.إ |
| 10 | 5.33 % | 2,546د.إ | 30,555د.إ |
136,369د.إ 23%
Total ROI For 10 Years
District Classification
Rating
B+
Area map
Statistics
Population
44,001
Social Status
Married : 62%
Unmarried : 27%
area
138 Km2
Price Changes Over Last 5 Years
1 Year Change
10.99%
3 Year Change
420.1%
5 Year Change
462.4%
Projects Have same ROI in This Area
Have Question Or Suggestion ?
Please Share Your Thought, To Make It Real


