Return on Investment In Turkey
We are providing a financial metric for real estate investors as it helps them to determine the profitability of their real estate investment in Turkey
448€
Average Income
299€ - 598€
Min Income - Max Income
0€
Cash Price
| Year | Annual Increase | Monthly ROI | Annual ROI |
|---|---|---|---|
| 1 | 0.00 % | 448€ | 5,380€ |
| 2 | 0.00 % | 560€ | 6,726€ |
| 3 | 0.00 % | 701€ | 8,407€ |
| 4 | 0.00 % | 876€ | 10,509€ |
| 5 | 0.00 % | 1,095€ | 13,136€ |
| 6 | 0.00 % | 1,368€ | 16,420€ |
| 7 | 0.00 % | 1,710€ | 20,525€ |
| 8 | 0.00 % | 2,138€ | 25,656€ |
| 9 | 0.00 % | 2,673€ | 32,070€ |
| 10 | 0.00 % | 3,341€ | 40,087€ |
178,915€ 0%
Total ROI For 10 Years
598€
Max Income
0€
Cash Price
| Year | Annual Increase | Monthly ROI | Annual ROI |
|---|---|---|---|
| 1 | 0.00 % | 598€ | 7,174€ |
| 2 | 0.00 % | 747€ | 8,967€ |
| 3 | 0.00 % | 934€ | 11,209€ |
| 4 | 0.00 % | 1,168€ | 14,012€ |
| 5 | 0.00 % | 1,460€ | 17,514€ |
| 6 | 0.00 % | 1,824€ | 21,893€ |
| 7 | 0.00 % | 2,281€ | 27,366€ |
| 8 | 0.00 % | 2,851€ | 34,208€ |
| 9 | 0.00 % | 3,563€ | 42,760€ |
| 10 | 0.00 % | 4,454€ | 53,450€ |
238,554€ 0%
Total ROI For 10 Years
299€
Min Income
0€
Cash Price
| Year | Annual Increase | Monthly ROI | Annual ROI |
|---|---|---|---|
| 1 | 0.00 % | 299€ | 3,587€ |
| 2 | 0.00 % | 374€ | 4,484€ |
| 3 | 0.00 % | 467€ | 5,605€ |
| 4 | 0.00 % | 584€ | 7,006€ |
| 5 | 0.00 % | 730€ | 8,757€ |
| 6 | 0.00 % | 912€ | 10,947€ |
| 7 | 0.00 % | 1,140€ | 13,683€ |
| 8 | 0.00 % | 1,425€ | 17,104€ |
| 9 | 0.00 % | 1,782€ | 21,380€ |
| 10 | 0.00 % | 2,227€ | 26,725€ |
119,277€ 0%
Total ROI For 10 Years
District Classification
Rating
B-
Area map
Statistics
Population
711,894
Social Status
Married : 63%
Unmarried : 28%
area
167 Km2
Price Changes Over Last 5 Years
1 Year Change
17.58%
3 Year Change
281.3%
5 Year Change
294.6%
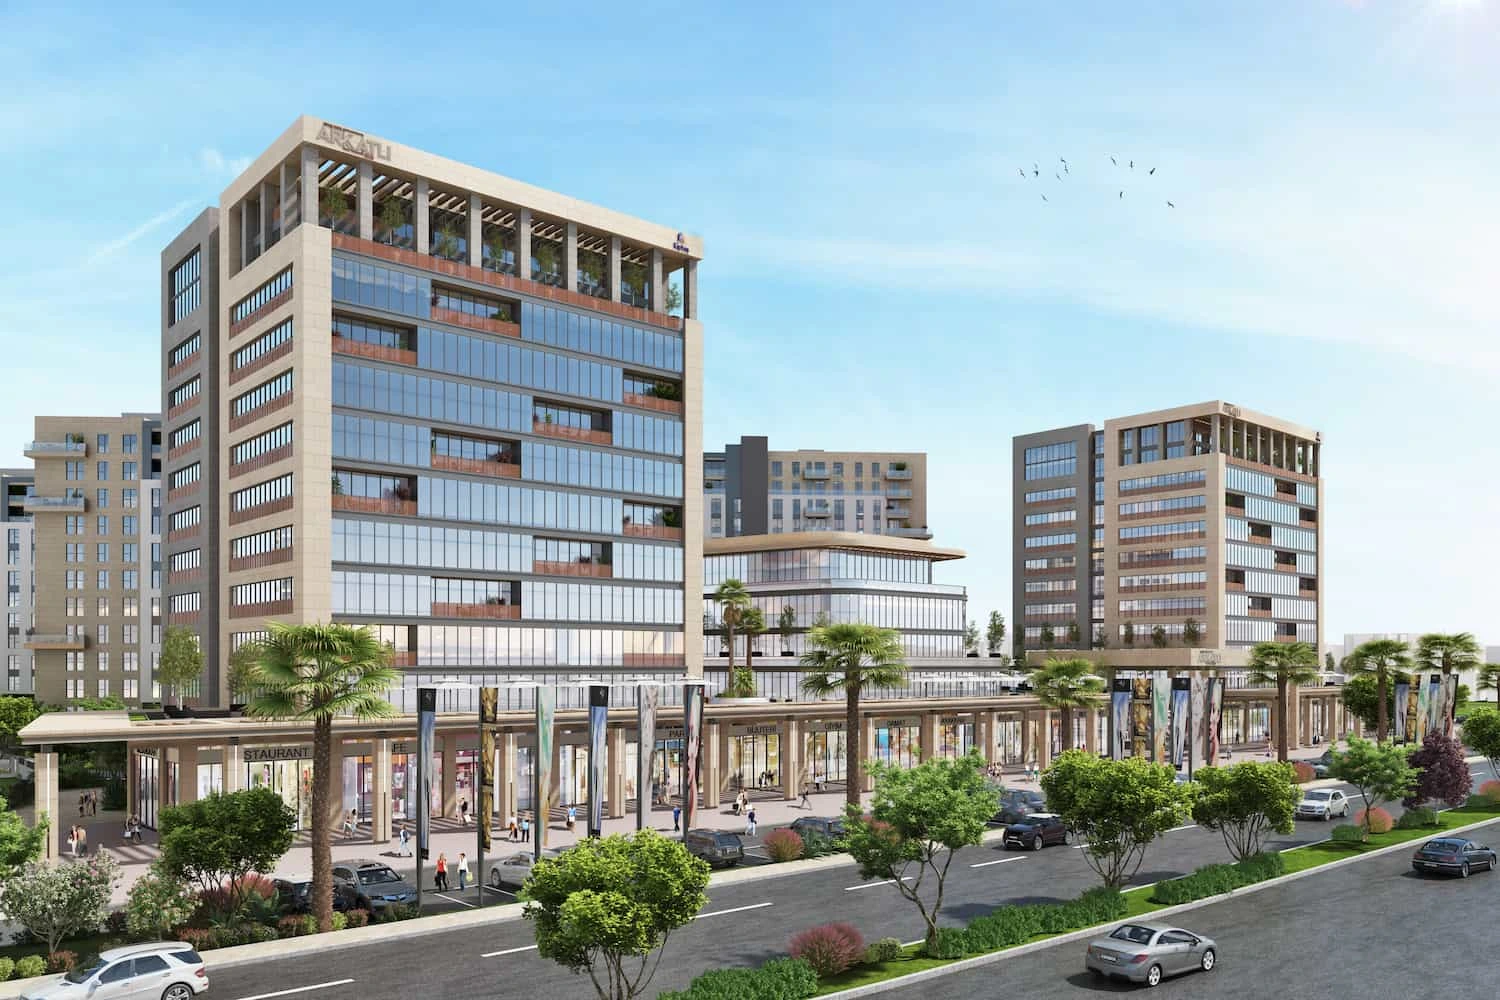
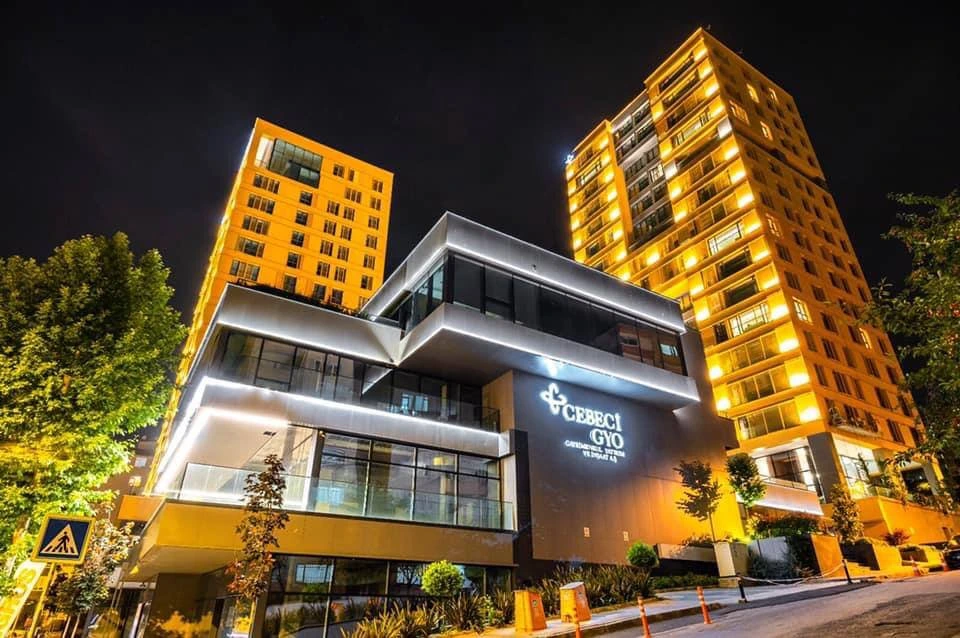
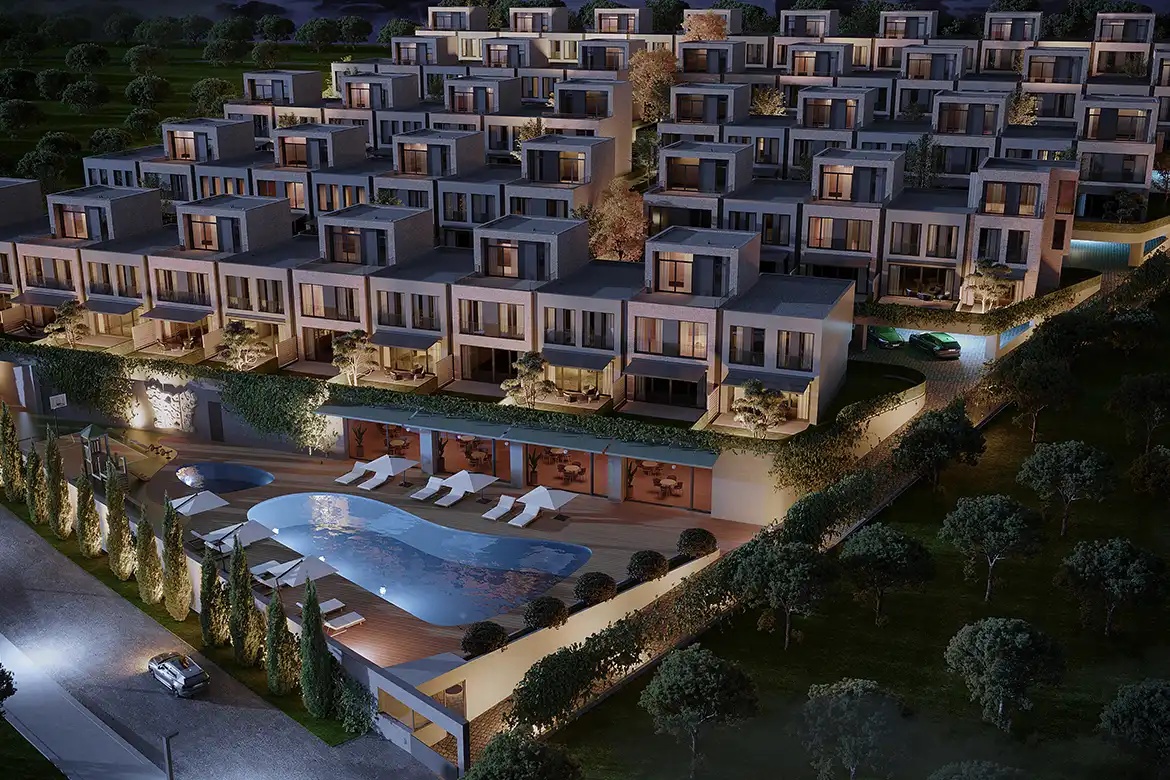
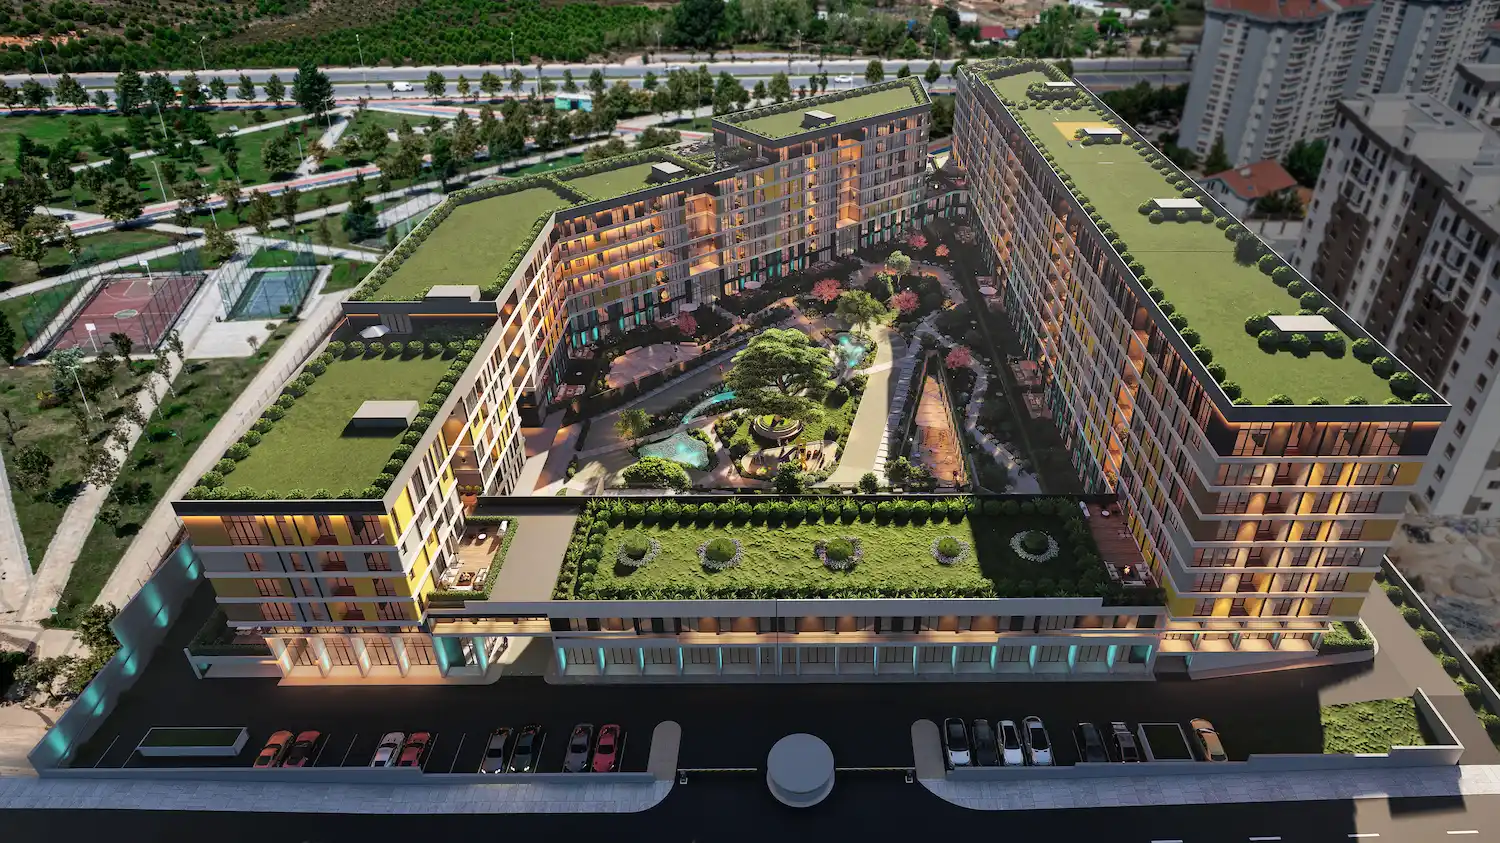
Projects Have same ROI in This Area
Have Question Or Suggestion ?
Please Share Your Thought, To Make It Real
.webp)
.webp)


