Return on Investment In Turkey
We are providing a financial metric for real estate investors as it helps them to determine the profitability of their real estate investment in Turkey
1,238$
Average Income
929$ - 1,548$
Min Income - Max Income
293,382$
Cash Price
| Year | Annual Increase | Monthly ROI | Annual ROI |
|---|---|---|---|
| 1 | 5.07 % | 1,238$ | 14,862$ |
| 2 | 6.33 % | 1,548$ | 18,577$ |
| 3 | 7.92 % | 1,935$ | 23,222$ |
| 4 | 9.89 % | 2,419$ | 29,027$ |
| 5 | 12.37 % | 3,024$ | 36,284$ |
| 6 | 15.46 % | 3,780$ | 45,355$ |
| 7 | 19.32 % | 4,724$ | 56,693$ |
| 8 | 24.16 % | 5,906$ | 70,867$ |
| 9 | 30.19 % | 7,382$ | 88,583$ |
| 10 | 37.74 % | 9,227$ | 110,729$ |
494,199$ 168%
Total ROI For 10 Years
1,548$
Max Income
293,382$
Cash Price
| Year | Annual Increase | Monthly ROI | Annual ROI |
|---|---|---|---|
| 1 | 6.33 % | 1,548$ | 18,577$ |
| 2 | 7.92 % | 1,935$ | 23,222$ |
| 3 | 9.89 % | 2,419$ | 29,027$ |
| 4 | 12.37 % | 3,024$ | 36,284$ |
| 5 | 15.46 % | 3,780$ | 45,355$ |
| 6 | 19.32 % | 4,724$ | 56,693$ |
| 7 | 24.16 % | 5,906$ | 70,867$ |
| 8 | 30.19 % | 7,382$ | 88,583$ |
| 9 | 37.74 % | 9,227$ | 110,729$ |
| 10 | 47.18 % | 11,534$ | 138,412$ |
617,749$ 210%
Total ROI For 10 Years
929$
Min Income
293,382$
Cash Price
| Year | Annual Increase | Monthly ROI | Annual ROI |
|---|---|---|---|
| 1 | 3.80 % | 929$ | 11,146$ |
| 2 | 4.75 % | 1,161$ | 13,933$ |
| 3 | 5.94 % | 1,451$ | 17,416$ |
| 4 | 7.42 % | 1,814$ | 21,770$ |
| 5 | 9.28 % | 2,268$ | 27,213$ |
| 6 | 11.59 % | 2,835$ | 34,016$ |
| 7 | 14.49 % | 3,543$ | 42,520$ |
| 8 | 18.12 % | 4,429$ | 53,150$ |
| 9 | 22.65 % | 5,536$ | 66,438$ |
| 10 | 28.31 % | 6,921$ | 83,047$ |
370,649$ 126%
Total ROI For 10 Years
District Classification
Rating
b+
Area map
Statistics
Population
381,110
Social Status
Married : 67%
Unmarried : 26%
area
230 Km2
Price Changes Over Last 5 Years
1 Year Change
17.79%
3 Year Change
202%
5 Year Change
253%
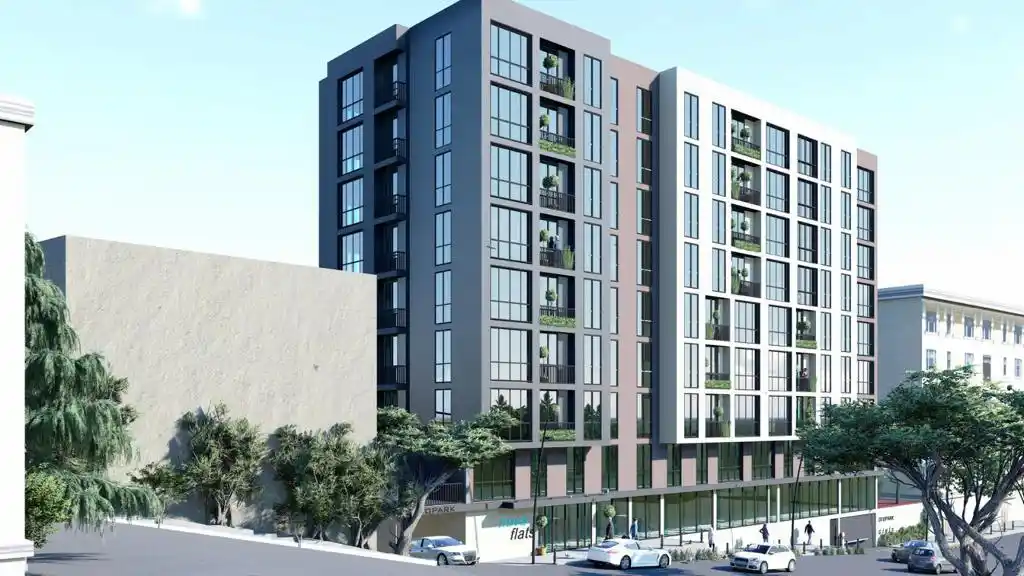
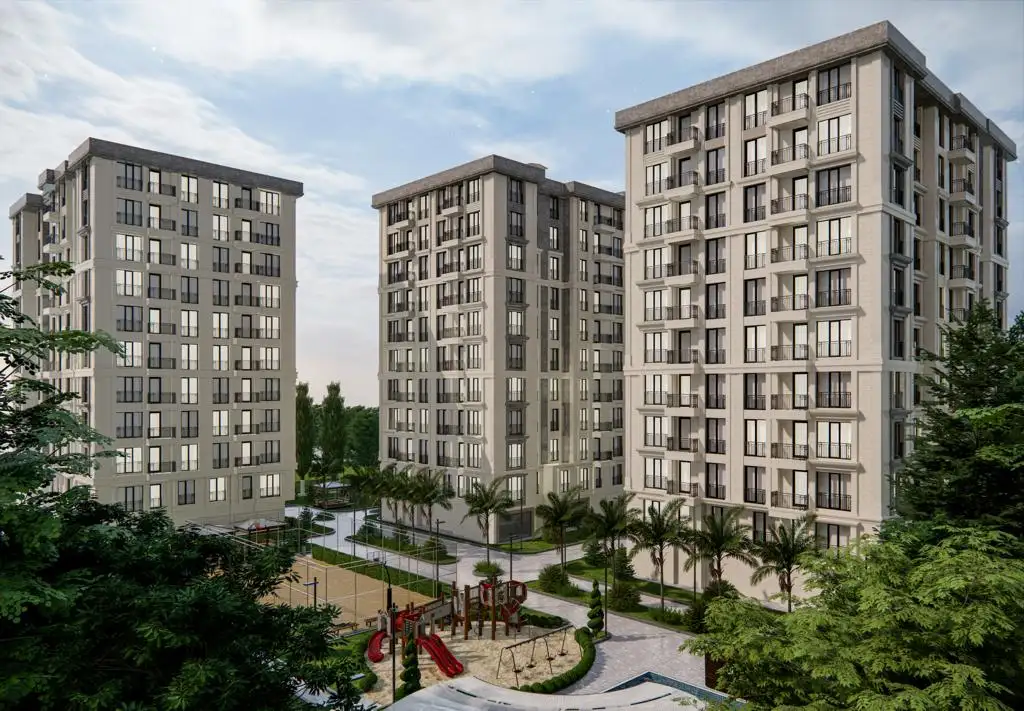
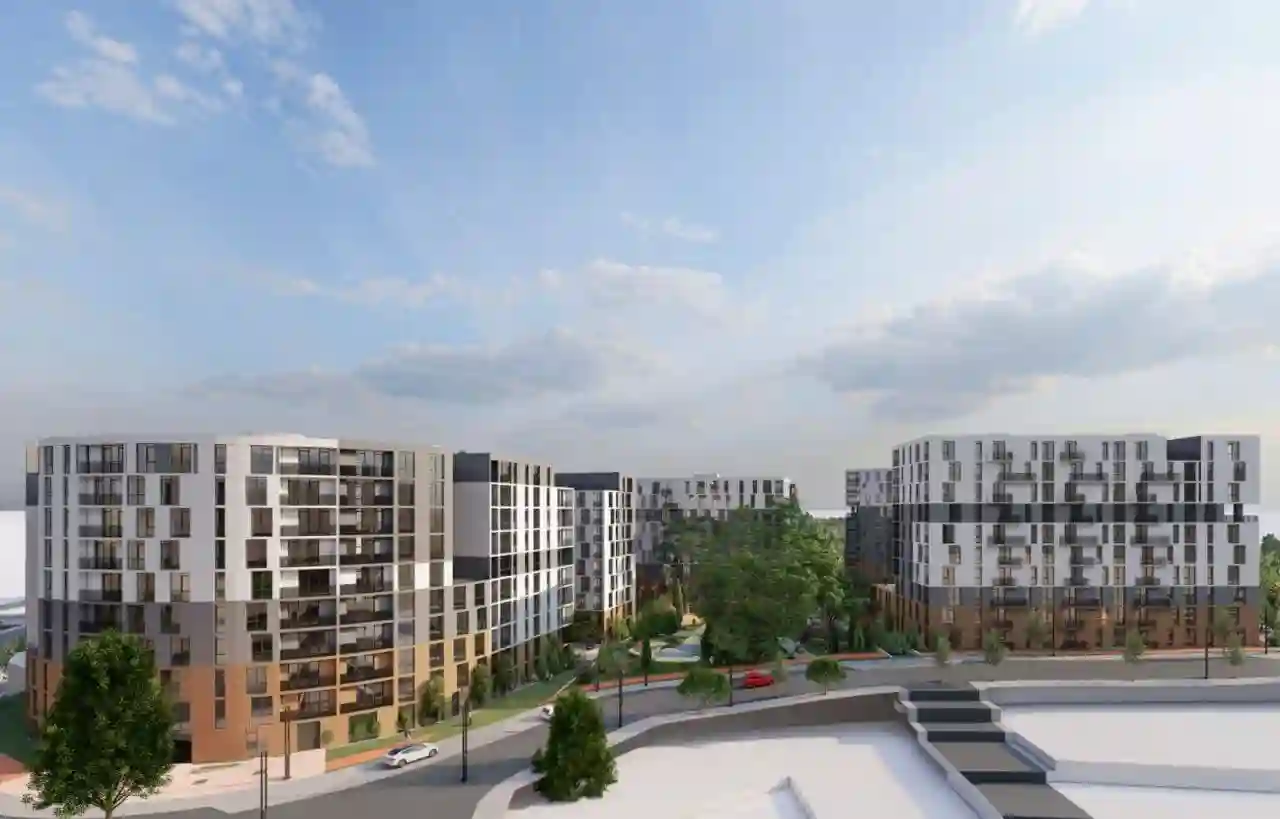
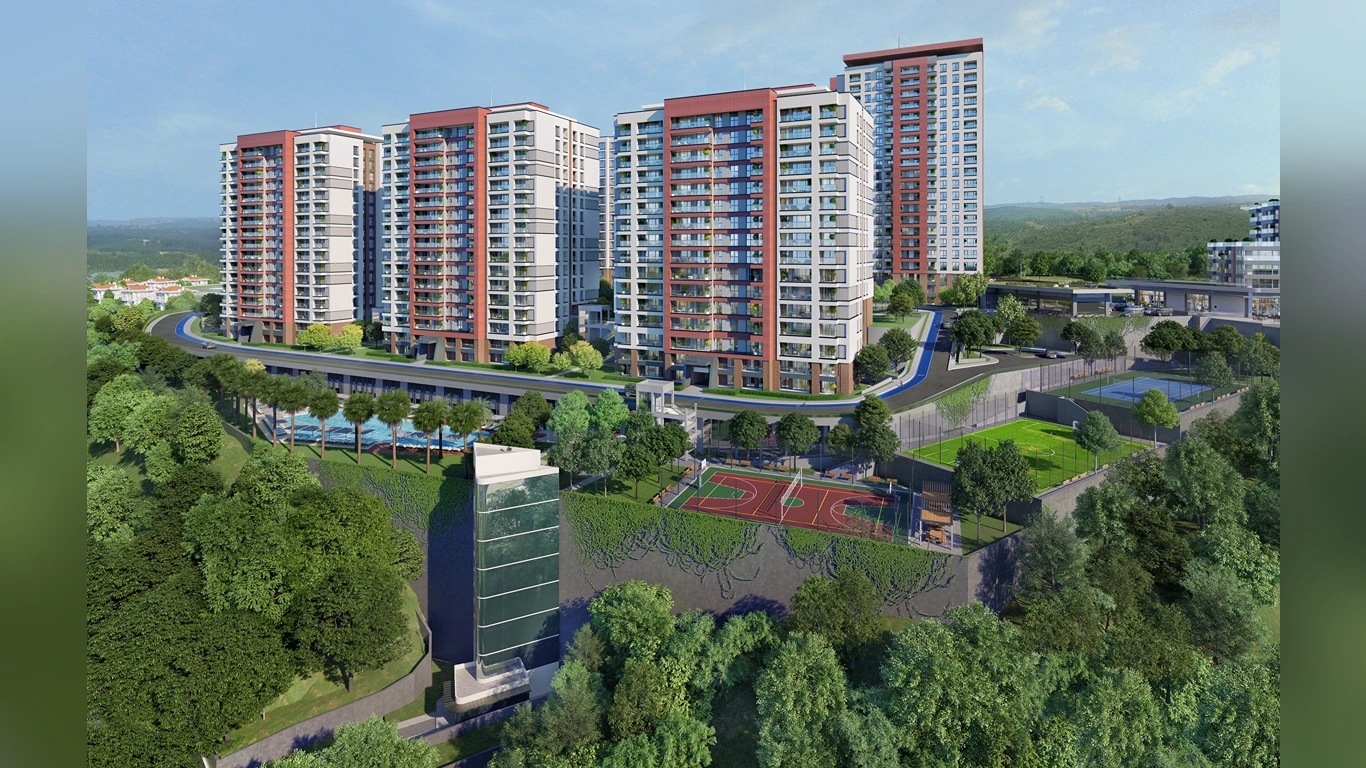
Projects Have same ROI in This Area


.webp)
Have Question Or Suggestion ?
Please Share Your Thought, To Make It Real


