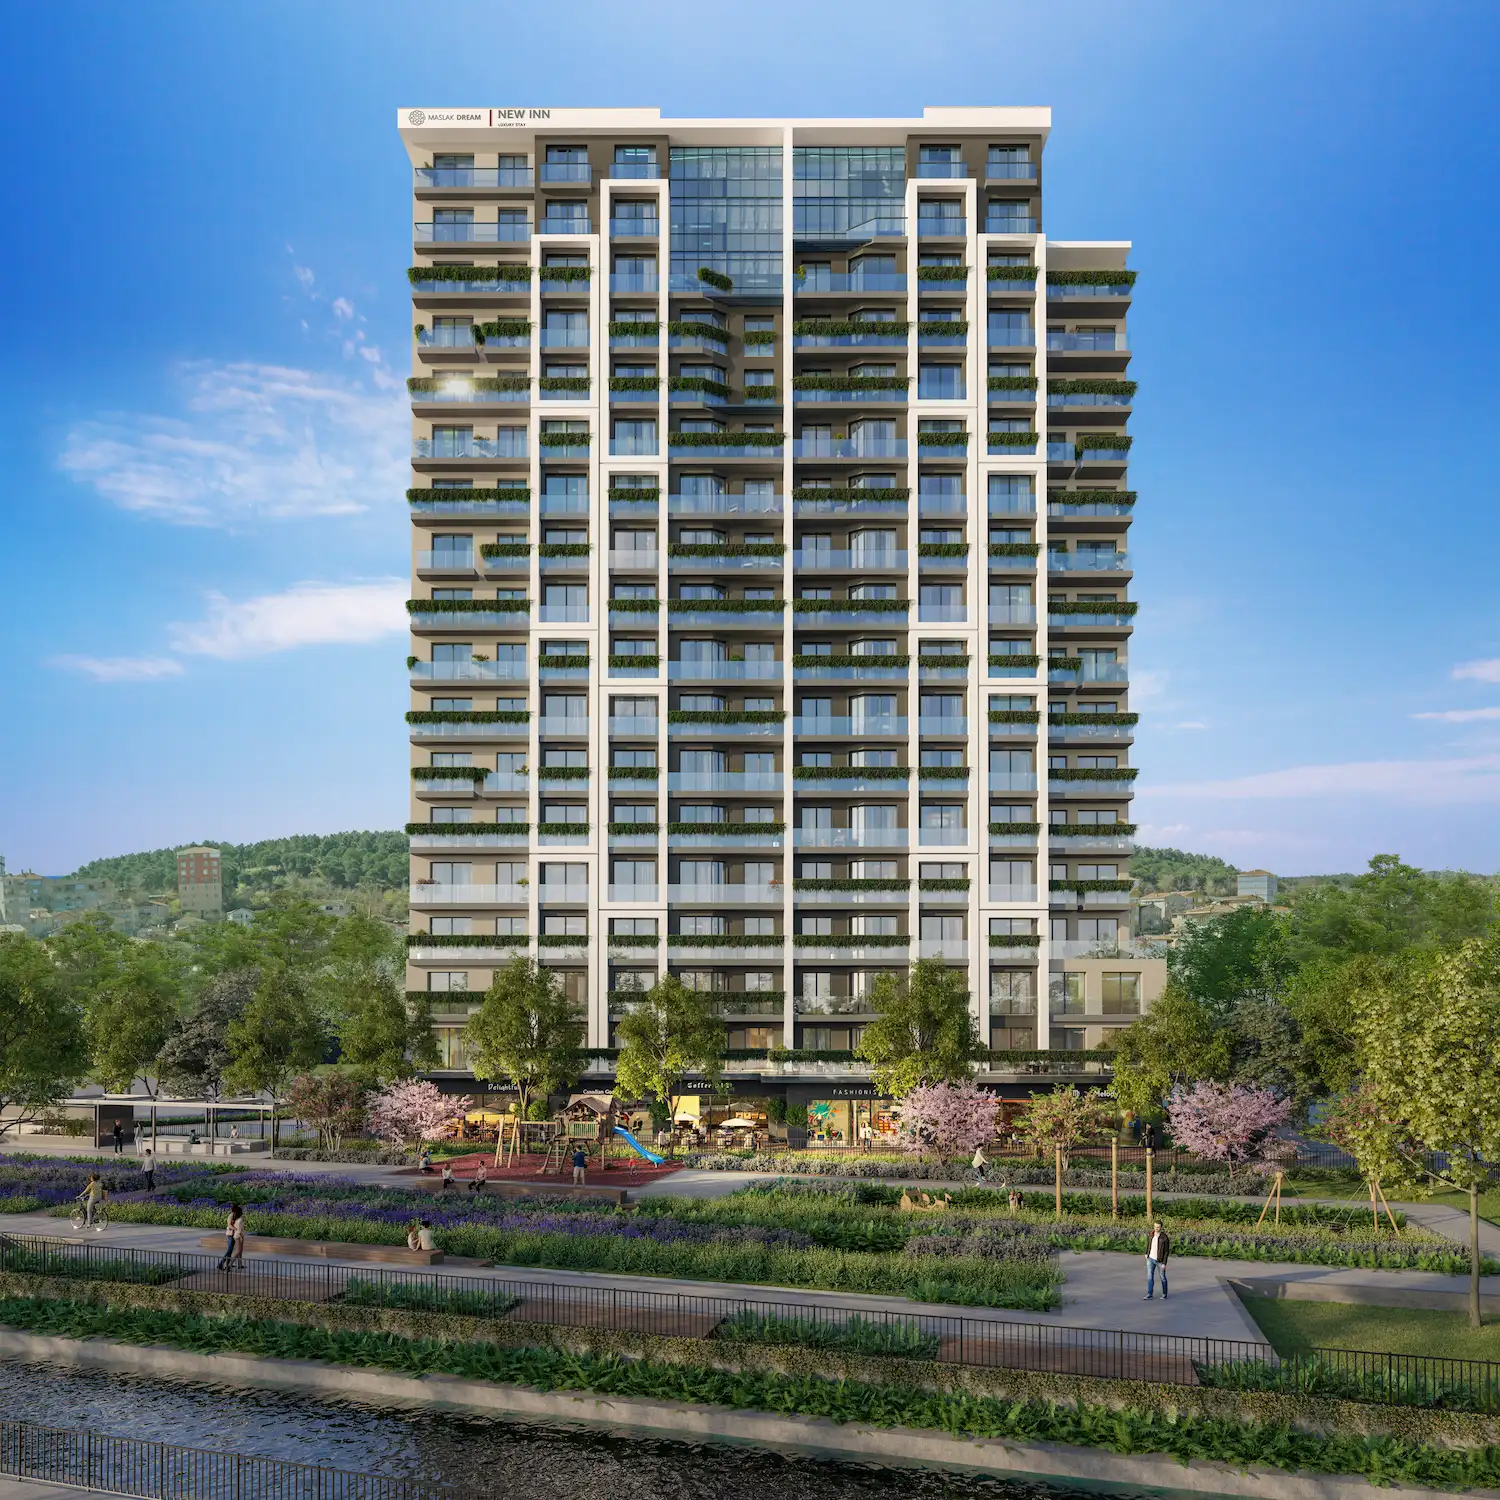
Return on Investment In Turkey
We are providing a financial metric for real estate investors as it helps them to determine the profitability of their real estate investment in Turkey
1,313$
Average Income
1,081$ - 1,545$
Min Income - Max Income
993,105$
Cash Price
| Year | Annual Increase | Monthly ROI | Annual ROI |
|---|---|---|---|
| 1 | 1.59 % | 1,313$ | 15,756$ |
| 2 | 1.98 % | 1,641$ | 19,695$ |
| 3 | 2.48 % | 2,052$ | 24,618$ |
| 4 | 3.10 % | 2,564$ | 30,773$ |
| 5 | 3.87 % | 3,206$ | 38,466$ |
| 6 | 4.84 % | 4,007$ | 48,083$ |
| 7 | 6.05 % | 5,009$ | 60,104$ |
| 8 | 7.57 % | 6,261$ | 75,130$ |
| 9 | 9.46 % | 7,826$ | 93,912$ |
| 10 | 11.82 % | 9,782$ | 117,390$ |
523,926$ 52%
Total ROI For 10 Years
1,545$
Max Income
993,105$
Cash Price
| Year | Annual Increase | Monthly ROI | Annual ROI |
|---|---|---|---|
| 1 | 1.87 % | 1,545$ | 18,536$ |
| 2 | 2.33 % | 1,931$ | 23,170$ |
| 3 | 2.92 % | 2,414$ | 28,963$ |
| 4 | 3.65 % | 3,017$ | 36,204$ |
| 5 | 4.56 % | 3,771$ | 45,255$ |
| 6 | 5.70 % | 4,714$ | 56,568$ |
| 7 | 7.12 % | 5,893$ | 70,710$ |
| 8 | 8.90 % | 7,366$ | 88,388$ |
| 9 | 11.13 % | 9,207$ | 110,485$ |
| 10 | 13.91 % | 11,509$ | 138,106$ |
616,384$ 62%
Total ROI For 10 Years
1,081$
Min Income
993,105$
Cash Price
| Year | Annual Increase | Monthly ROI | Annual ROI |
|---|---|---|---|
| 1 | 1.31 % | 1,081$ | 12,975$ |
| 2 | 1.63 % | 1,352$ | 16,219$ |
| 3 | 2.04 % | 1,690$ | 20,274$ |
| 4 | 2.55 % | 2,112$ | 25,343$ |
| 5 | 3.19 % | 2,640$ | 31,678$ |
| 6 | 3.99 % | 3,300$ | 39,598$ |
| 7 | 4.98 % | 4,125$ | 49,497$ |
| 8 | 6.23 % | 5,156$ | 61,871$ |
| 9 | 7.79 % | 6,445$ | 77,339$ |
| 10 | 9.73 % | 8,056$ | 96,674$ |
431,469$ 43%
Total ROI For 10 Years
District Classification
Rating
a+
Area map
Statistics
Population
10,185
Social Status
Married : 49%
Unmarried : 41%
area
10 Km2
Price Changes Over Last 5 Years
1 Year Change
13.48%
3 Year Change
416%
5 Year Change
448.7%
Projects Have same ROI in This Area
Have Question Or Suggestion ?
Please Share Your Thought, To Make It Real


