Return on Investment In Turkey
We are providing a financial metric for real estate investors as it helps them to determine the profitability of their real estate investment in Turkey
3,153$
Average Income
2,000$ - 4,307$
Min Income - Max Income
347,262$
Cash Price
| Year | Annual Increase | Monthly ROI | Annual ROI |
|---|---|---|---|
| 1 | 10.90 % | 3,153$ | 37,837$ |
| 2 | 13.62 % | 3,941$ | 47,296$ |
| 3 | 17.02 % | 4,927$ | 59,120$ |
| 4 | 21.28 % | 6,158$ | 73,900$ |
| 5 | 26.60 % | 7,698$ | 92,375$ |
| 6 | 33.25 % | 9,622$ | 115,469$ |
| 7 | 41.56 % | 12,028$ | 144,336$ |
| 8 | 51.96 % | 15,035$ | 180,420$ |
| 9 | 64.94 % | 18,794$ | 225,525$ |
| 10 | 81.18 % | 23,492$ | 281,906$ |
1,258,183$ 362%
Total ROI For 10 Years
4,307$
Max Income
347,262$
Cash Price
| Year | Annual Increase | Monthly ROI | Annual ROI |
|---|---|---|---|
| 1 | 14.88 % | 4,307$ | 51,680$ |
| 2 | 18.60 % | 5,383$ | 64,599$ |
| 3 | 23.25 % | 6,729$ | 80,749$ |
| 4 | 29.07 % | 8,411$ | 100,937$ |
| 5 | 36.33 % | 10,514$ | 126,171$ |
| 6 | 45.42 % | 13,143$ | 157,713$ |
| 7 | 56.77 % | 16,428$ | 197,142$ |
| 8 | 70.96 % | 20,536$ | 246,427$ |
| 9 | 88.70 % | 25,670$ | 308,034$ |
| 10 | 110.88 % | 32,087$ | 385,042$ |
1,718,494$ 494%
Total ROI For 10 Years
2,000$
Min Income
347,262$
Cash Price
| Year | Annual Increase | Monthly ROI | Annual ROI |
|---|---|---|---|
| 1 | 6.91 % | 2,000$ | 23,994$ |
| 2 | 8.64 % | 2,499$ | 29,993$ |
| 3 | 10.80 % | 3,124$ | 37,491$ |
| 4 | 13.50 % | 3,905$ | 46,863$ |
| 5 | 16.87 % | 4,882$ | 58,579$ |
| 6 | 21.09 % | 6,102$ | 73,224$ |
| 7 | 26.36 % | 7,628$ | 91,530$ |
| 8 | 32.95 % | 9,534$ | 114,413$ |
| 9 | 41.18 % | 11,918$ | 143,016$ |
| 10 | 51.48 % | 14,897$ | 178,770$ |
797,872$ 229%
Total ROI For 10 Years
District Classification
Rating
A+
Area map
Statistics
Population
349,970
Social Status
Married : 55%
Unmarried : 32%
area
174 Km2
Price Changes Over Last 5 Years
1 Year Change
11.84%
3 Year Change
445.3%
5 Year Change
490%
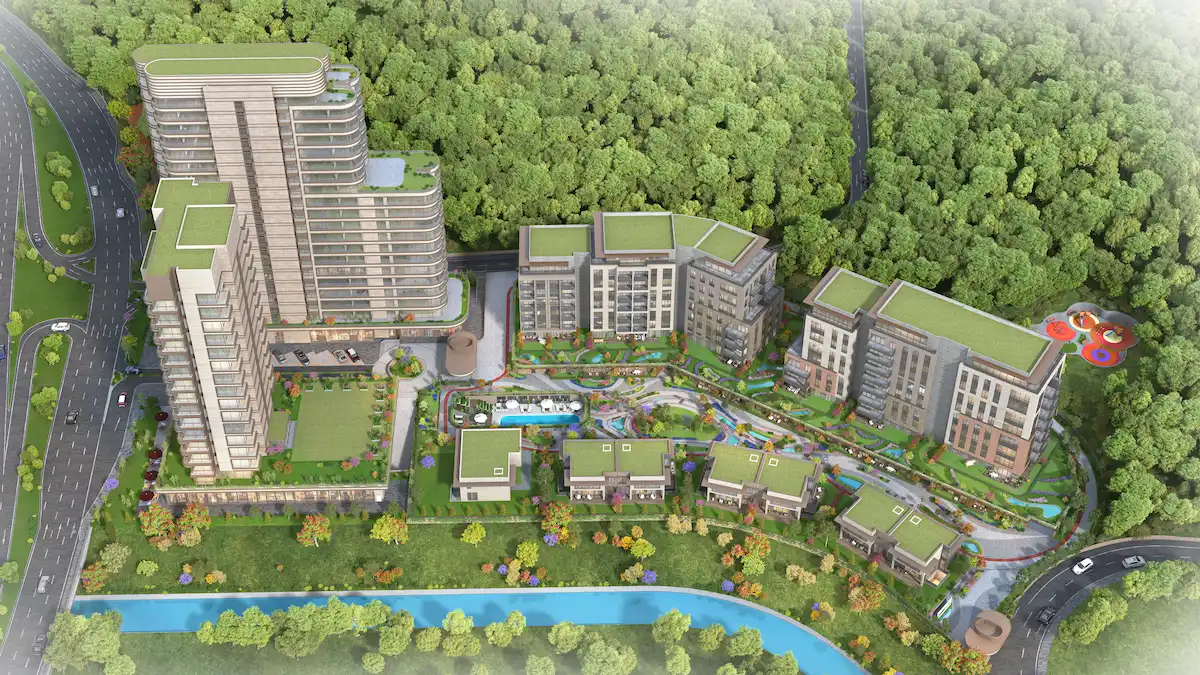
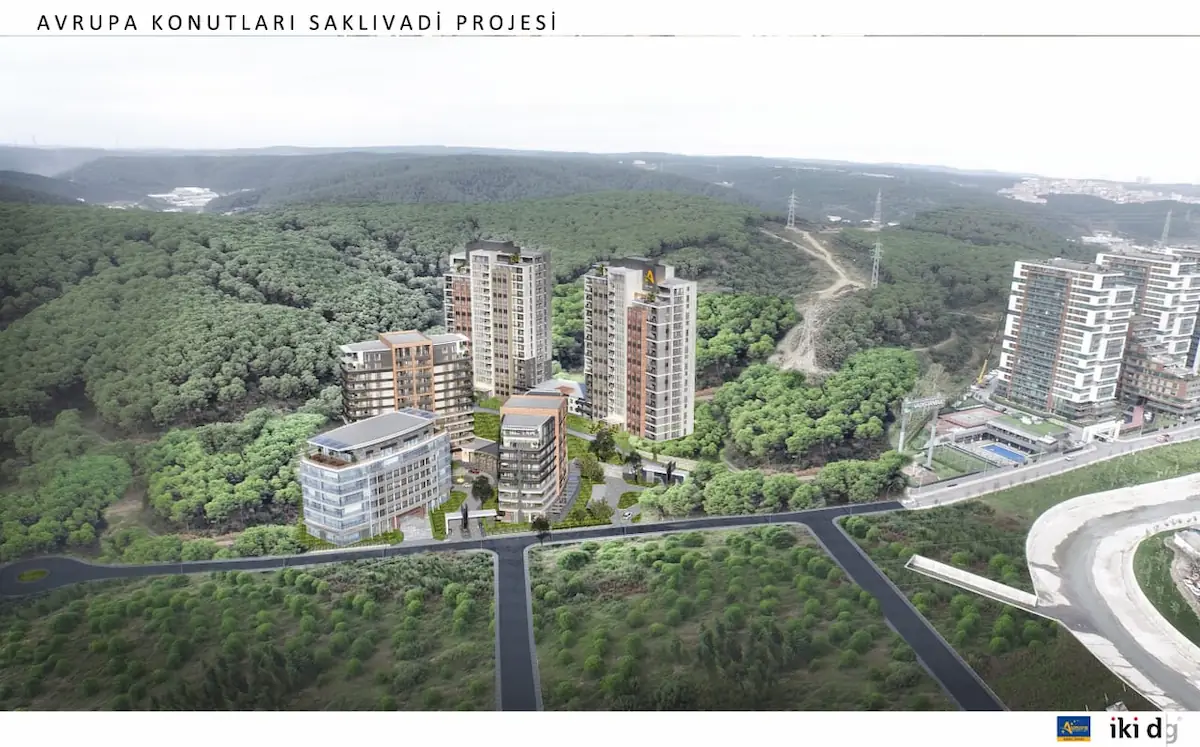
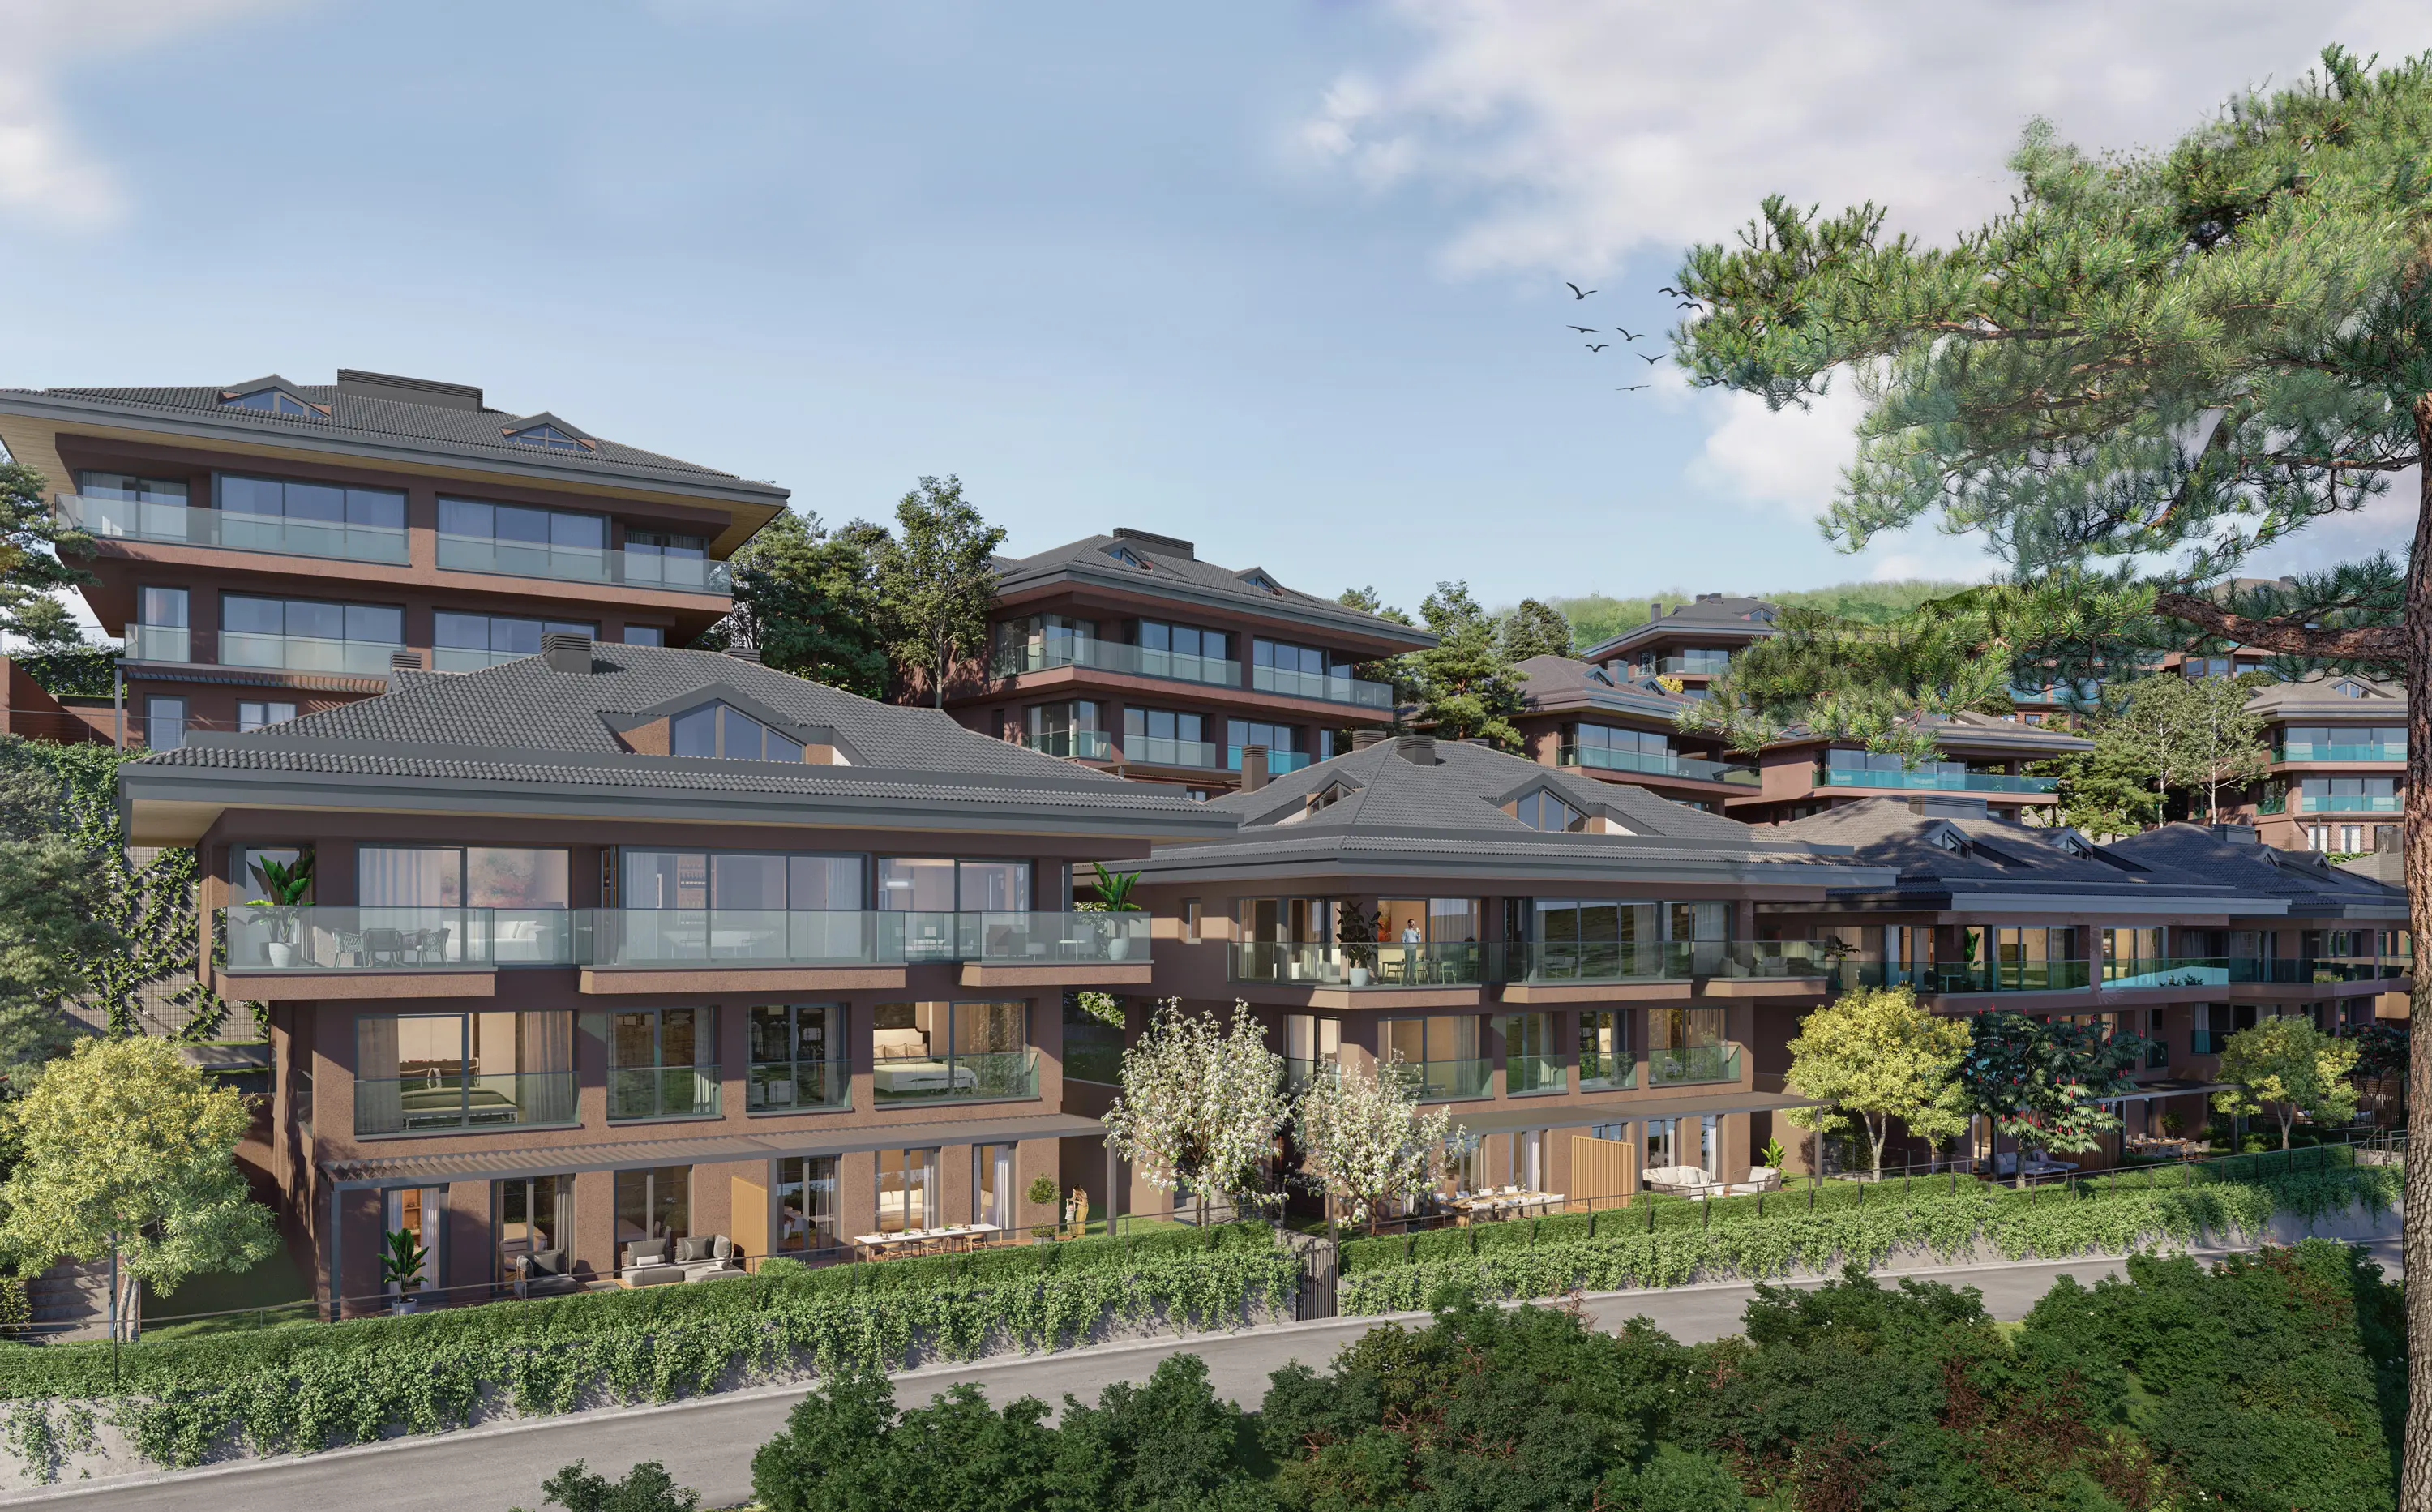
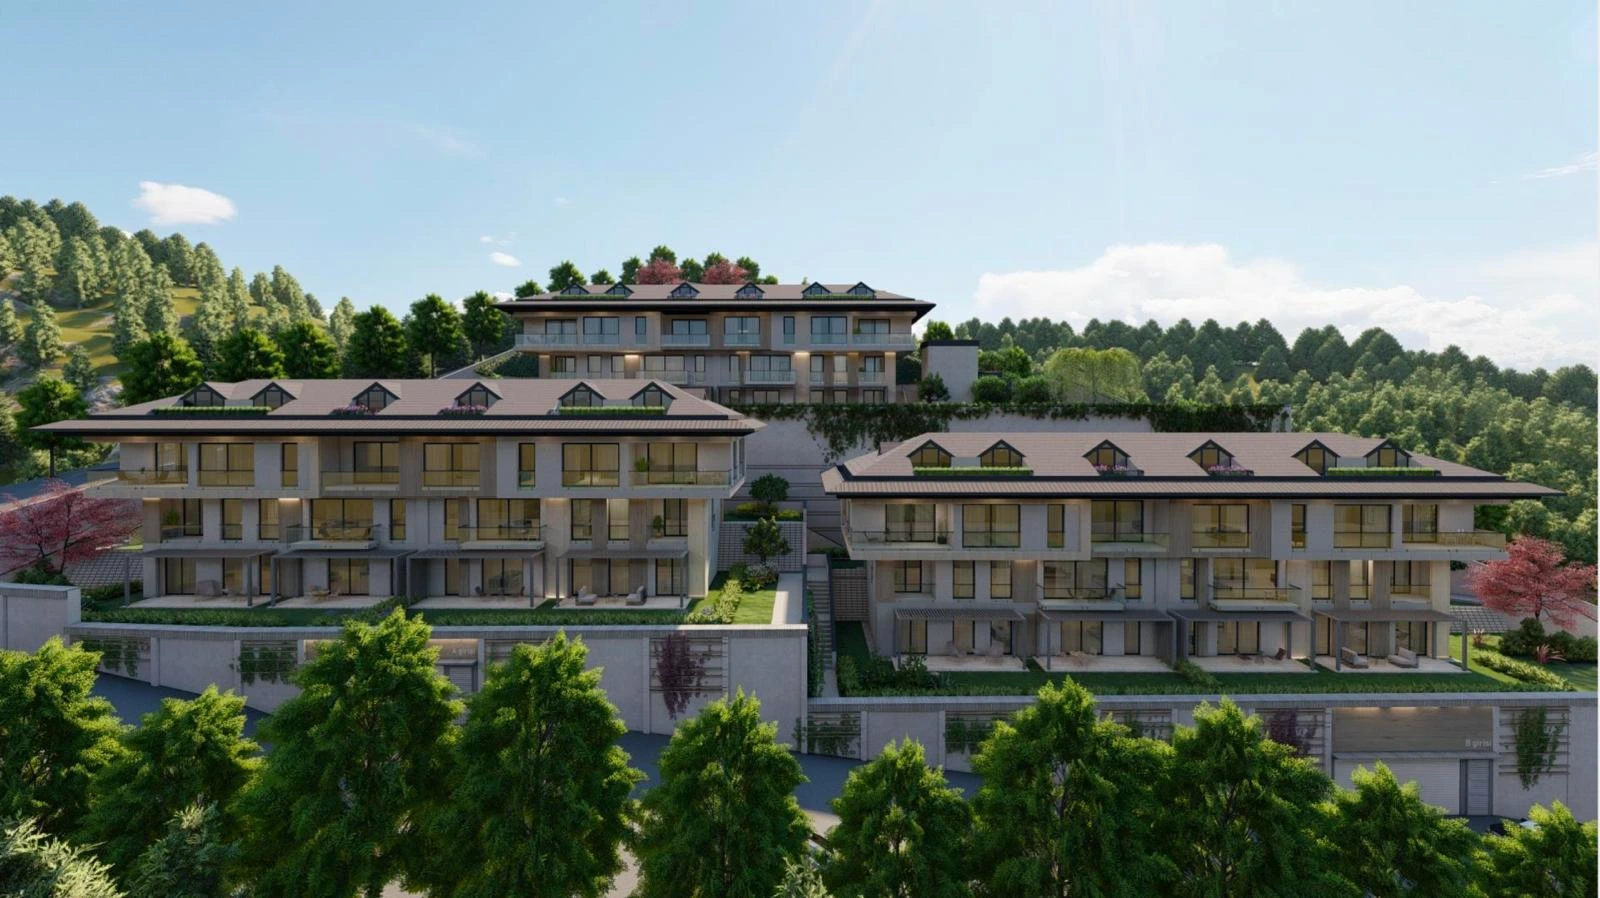
Projects Have same ROI in This Area


.webp)
Have Question Or Suggestion ?
Please Share Your Thought, To Make It Real


