Return on Investment In Turkey
We are providing a financial metric for real estate investors as it helps them to determine the profitability of their real estate investment in Turkey
620$
Average Income
465$ - 775$
Min Income - Max Income
10,164$
Cash Price
| Year | Annual Increase | Monthly ROI | Annual ROI |
|---|---|---|---|
| 1 | 73.23 % | 620$ | 7,443$ |
| 2 | 91.54 % | 775$ | 9,304$ |
| 3 | 114.43 % | 969$ | 11,630$ |
| 4 | 143.03 % | 1,211$ | 14,538$ |
| 5 | 178.79 % | 1,514$ | 18,172$ |
| 6 | 223.49 % | 1,893$ | 22,715$ |
| 7 | 279.36 % | 2,366$ | 28,394$ |
| 8 | 349.20 % | 2,958$ | 35,493$ |
| 9 | 436.50 % | 3,697$ | 44,366$ |
| 10 | 545.62 % | 4,621$ | 55,458$ |
247,514$ 2,435%
Total ROI For 10 Years
775$
Max Income
10,164$
Cash Price
| Year | Annual Increase | Monthly ROI | Annual ROI |
|---|---|---|---|
| 1 | 91.54 % | 775$ | 9,304$ |
| 2 | 114.43 % | 969$ | 11,630$ |
| 3 | 143.03 % | 1,211$ | 14,538$ |
| 4 | 178.79 % | 1,514$ | 18,172$ |
| 5 | 223.49 % | 1,893$ | 22,715$ |
| 6 | 279.36 % | 2,366$ | 28,394$ |
| 7 | 349.20 % | 2,958$ | 35,493$ |
| 8 | 436.50 % | 3,697$ | 44,366$ |
| 9 | 545.62 % | 4,621$ | 55,458$ |
| 10 | 682.03 % | 5,777$ | 69,322$ |
309,393$ 3,043%
Total ROI For 10 Years
465$
Min Income
10,164$
Cash Price
| Year | Annual Increase | Monthly ROI | Annual ROI |
|---|---|---|---|
| 1 | 54.92 % | 465$ | 5,583$ |
| 2 | 68.66 % | 582$ | 6,978$ |
| 3 | 85.82 % | 727$ | 8,723$ |
| 4 | 107.27 % | 909$ | 10,903$ |
| 5 | 134.09 % | 1,136$ | 13,629$ |
| 6 | 167.62 % | 1,420$ | 17,037$ |
| 7 | 209.52 % | 1,775$ | 21,296$ |
| 8 | 261.90 % | 2,218$ | 26,620$ |
| 9 | 327.37 % | 2,773$ | 33,275$ |
| 10 | 409.22 % | 3,466$ | 41,593$ |
185,636$ 1,826%
Total ROI For 10 Years
District Classification
Rating
a
Area map
Statistics
Population
448,882
Social Status
Married : 56%
Unmarried : 46%
area
52 Km2
Price Changes Over Last 5 Years
1 Year Change
13.64%
3 Year Change
339%
5 Year Change
370.8%
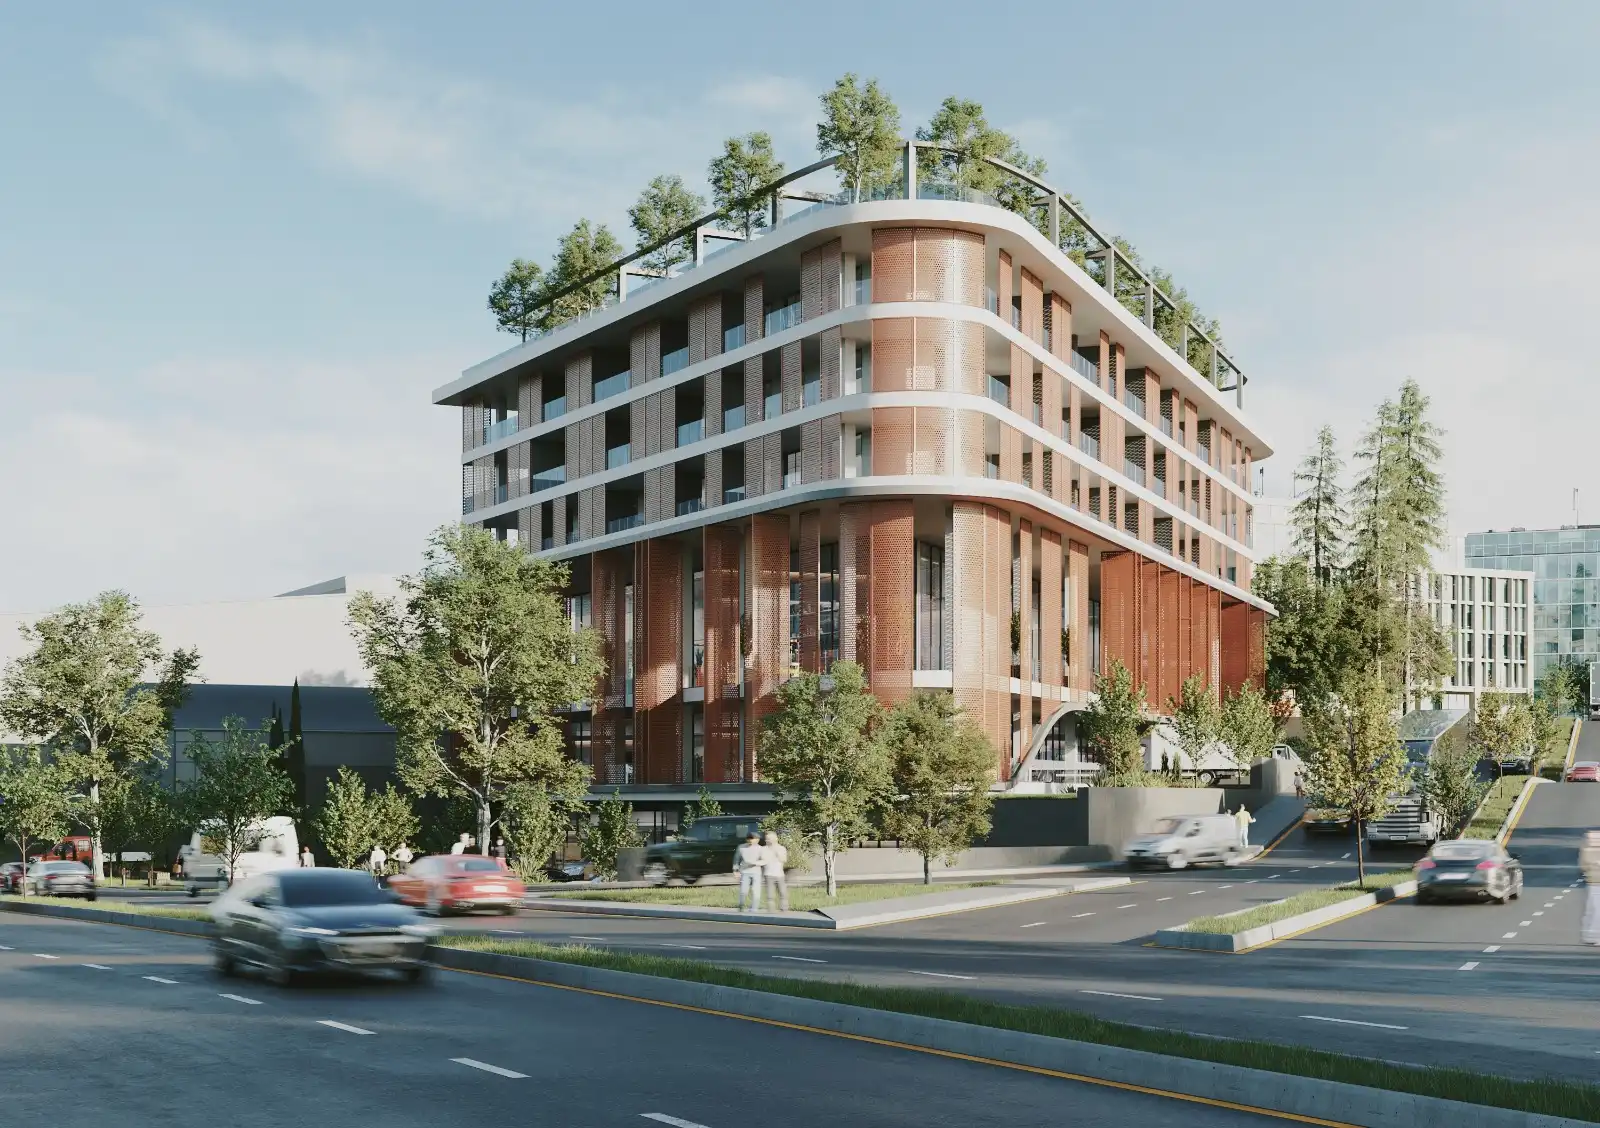
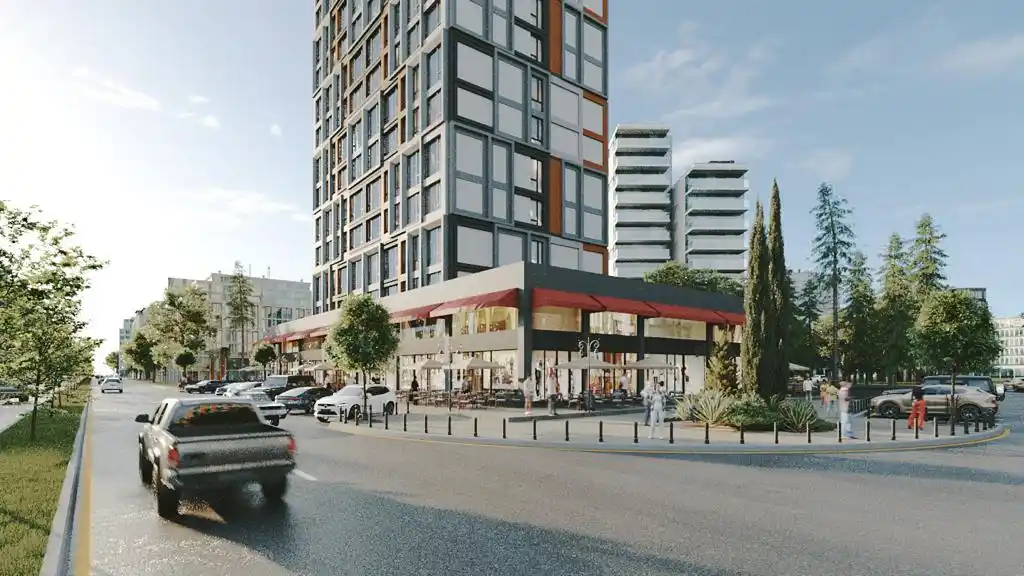
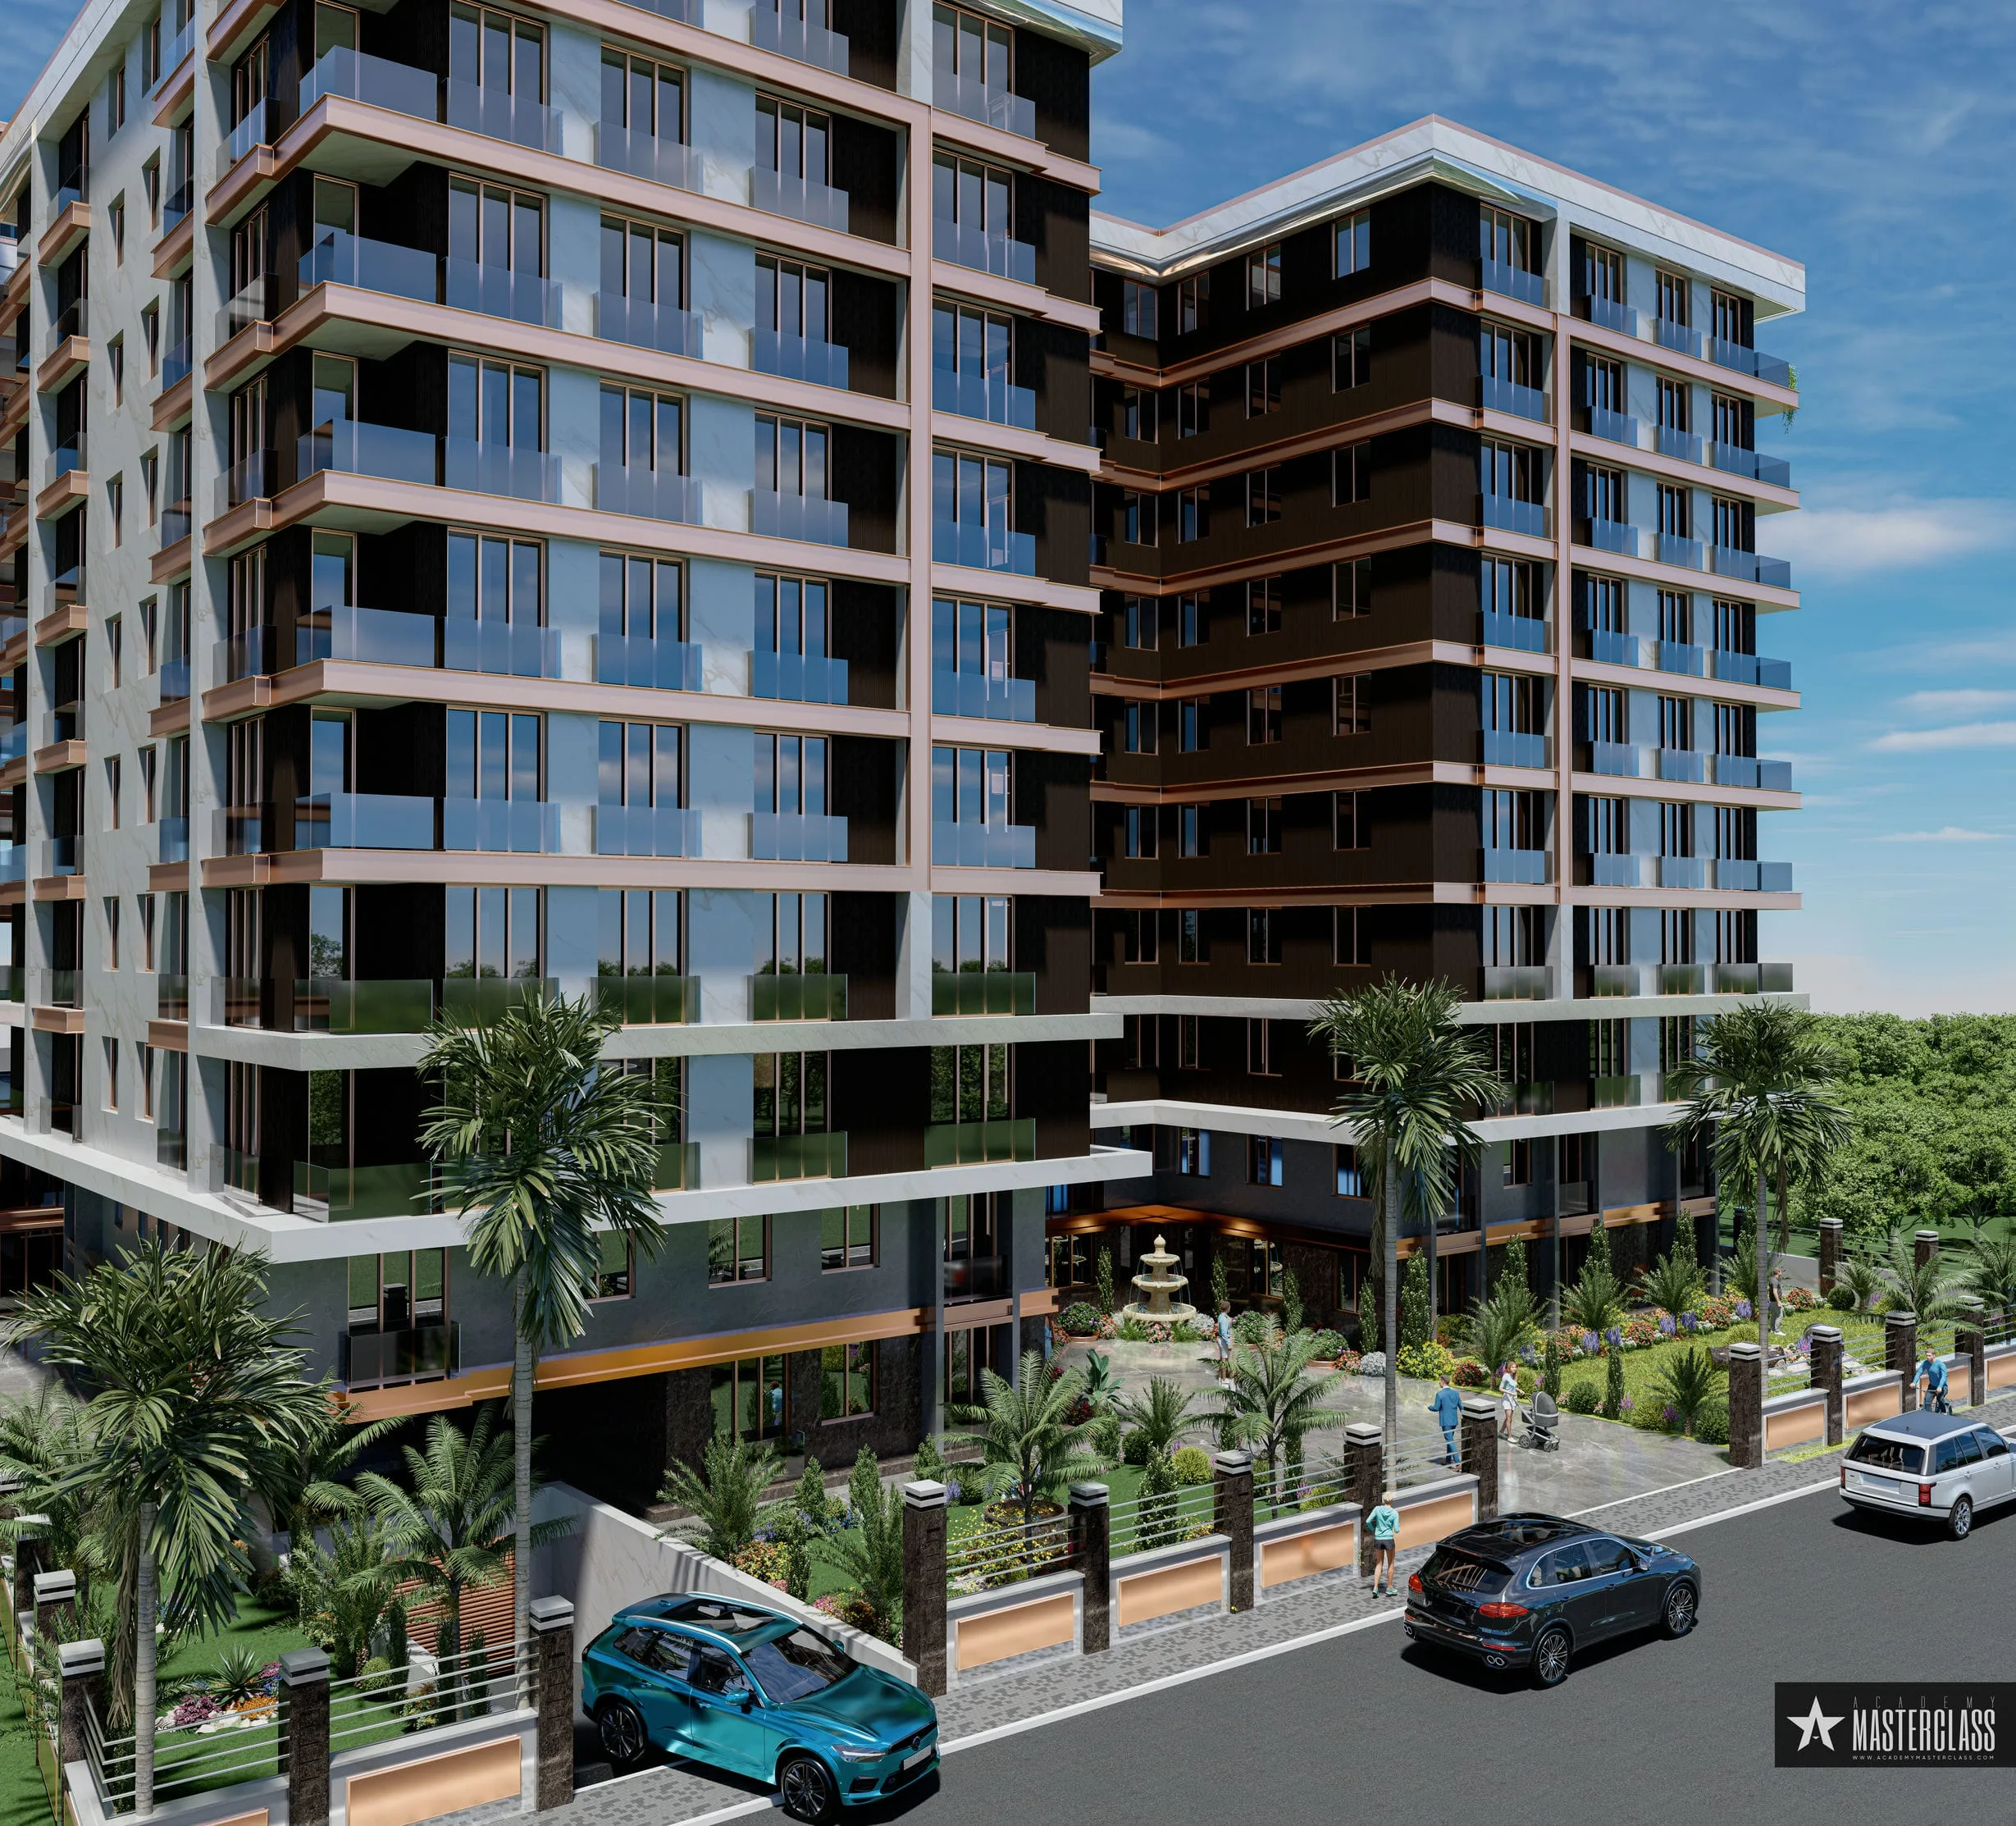
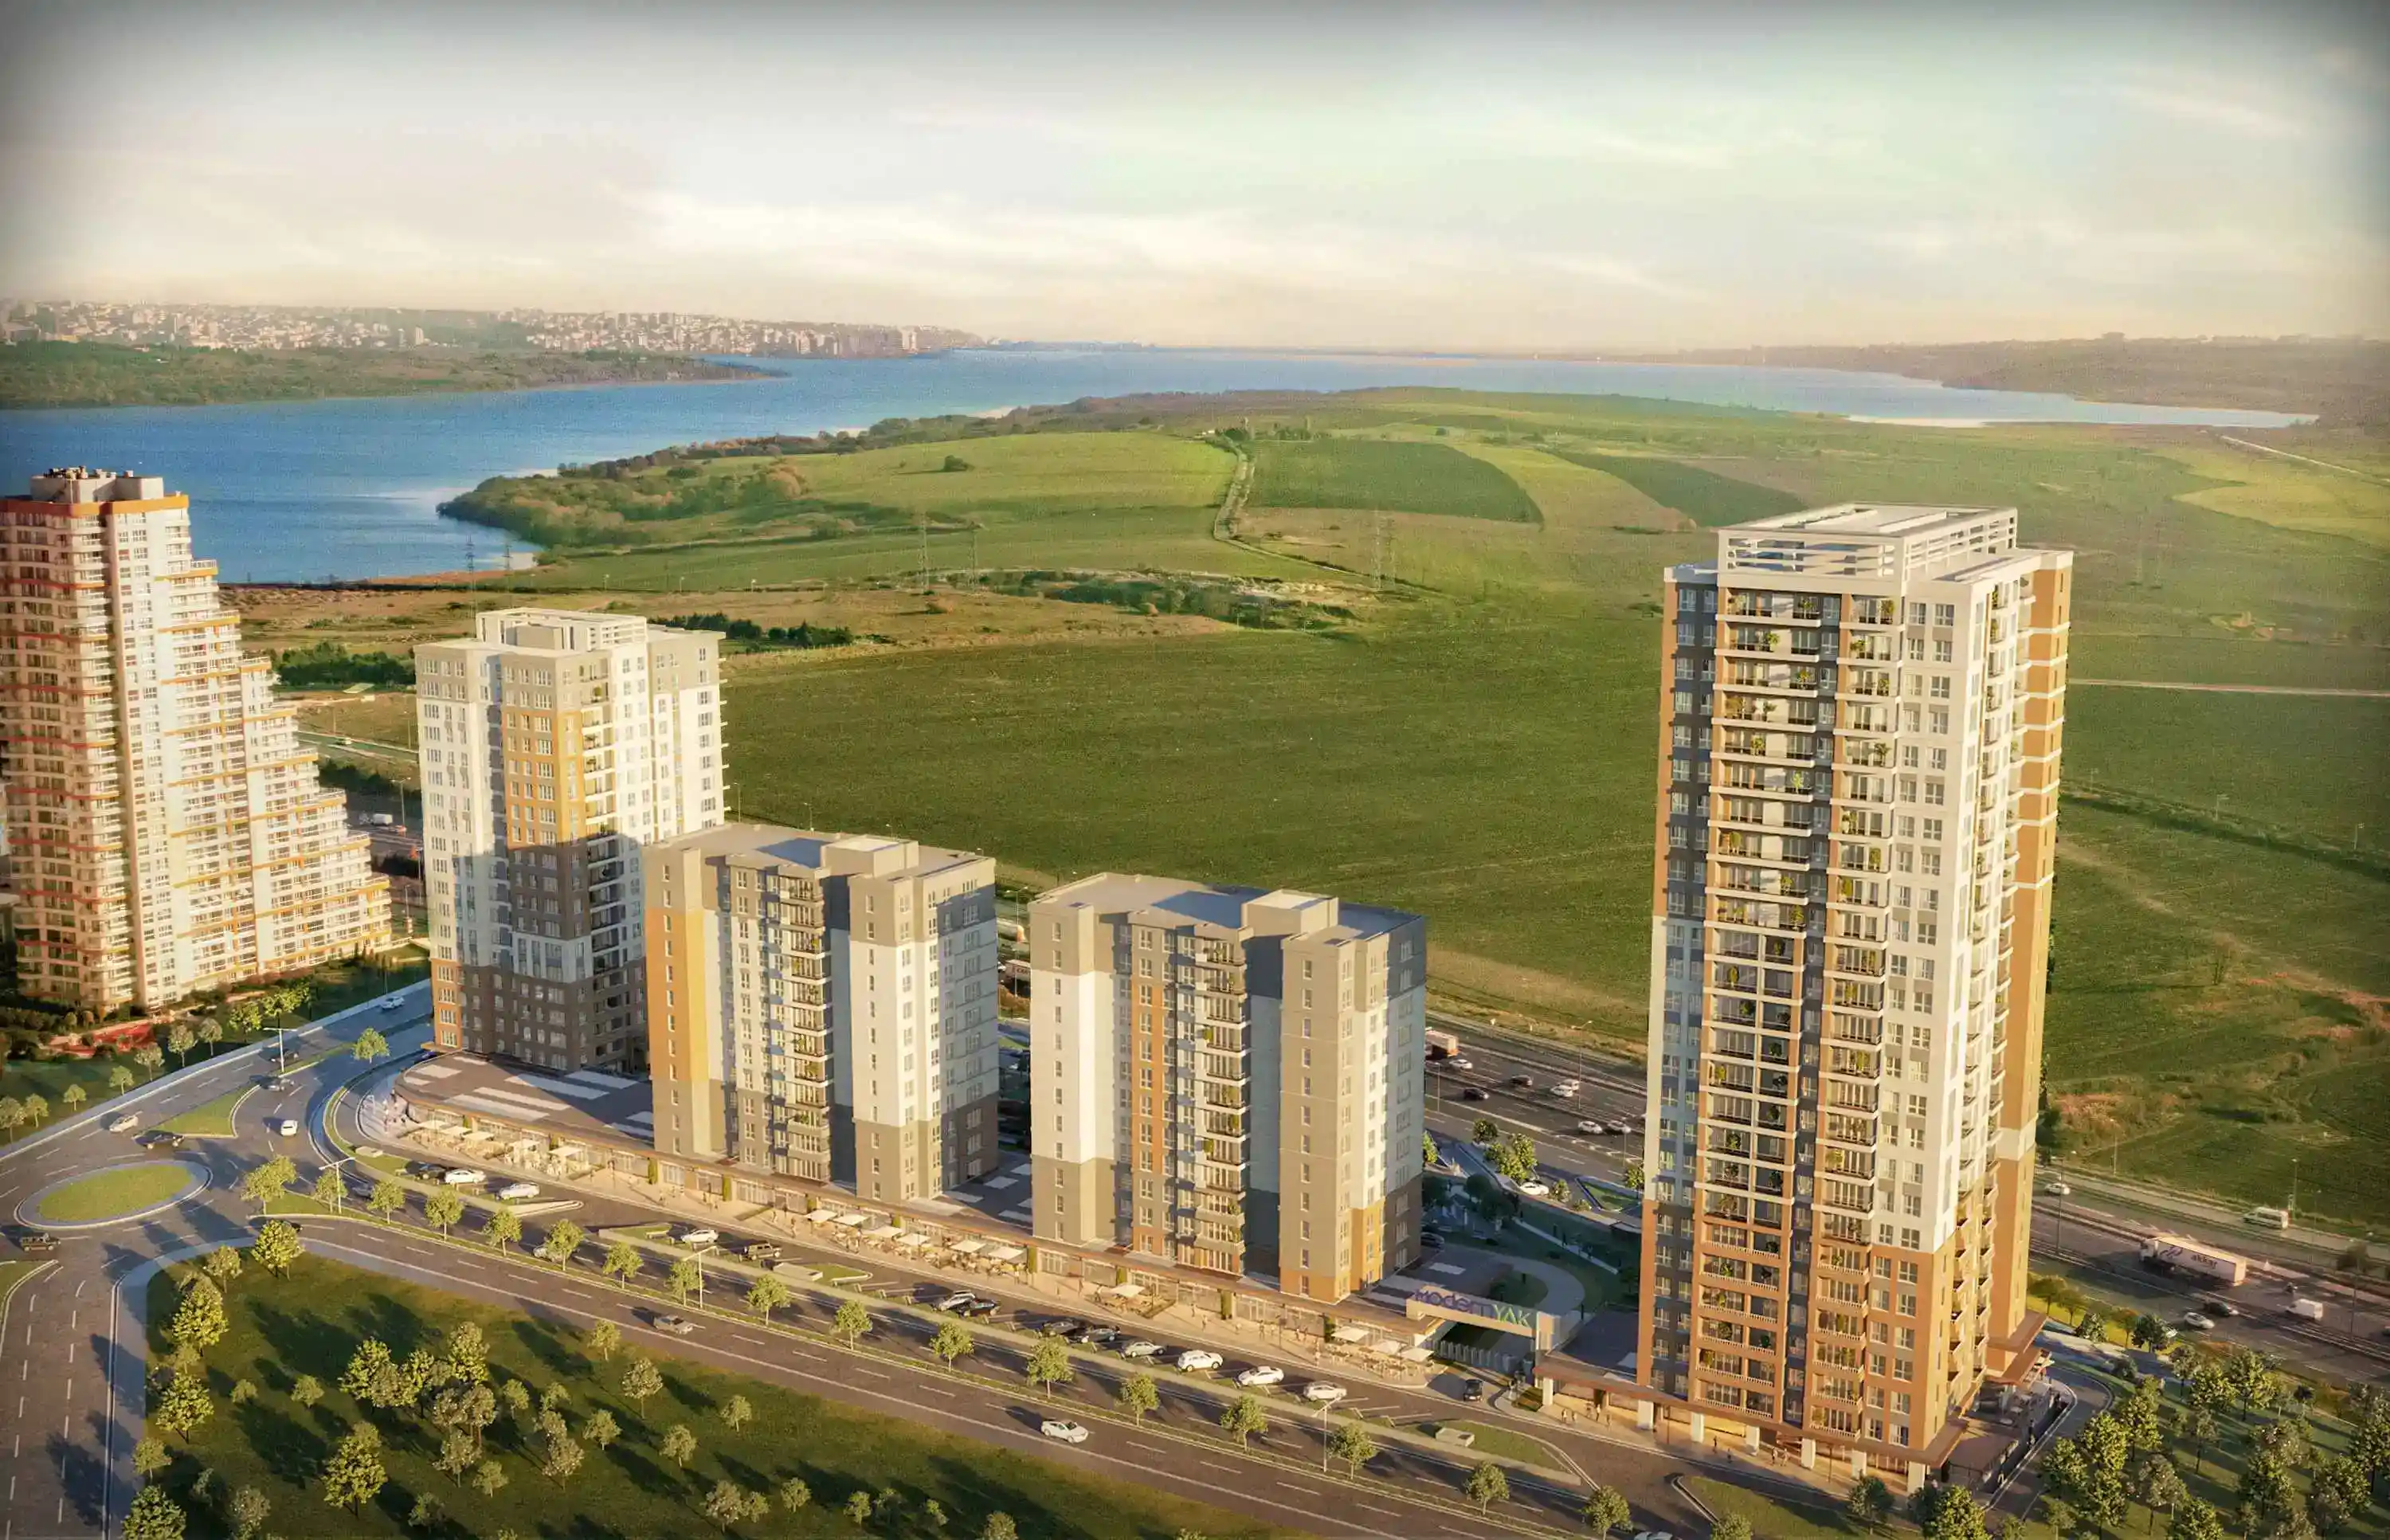
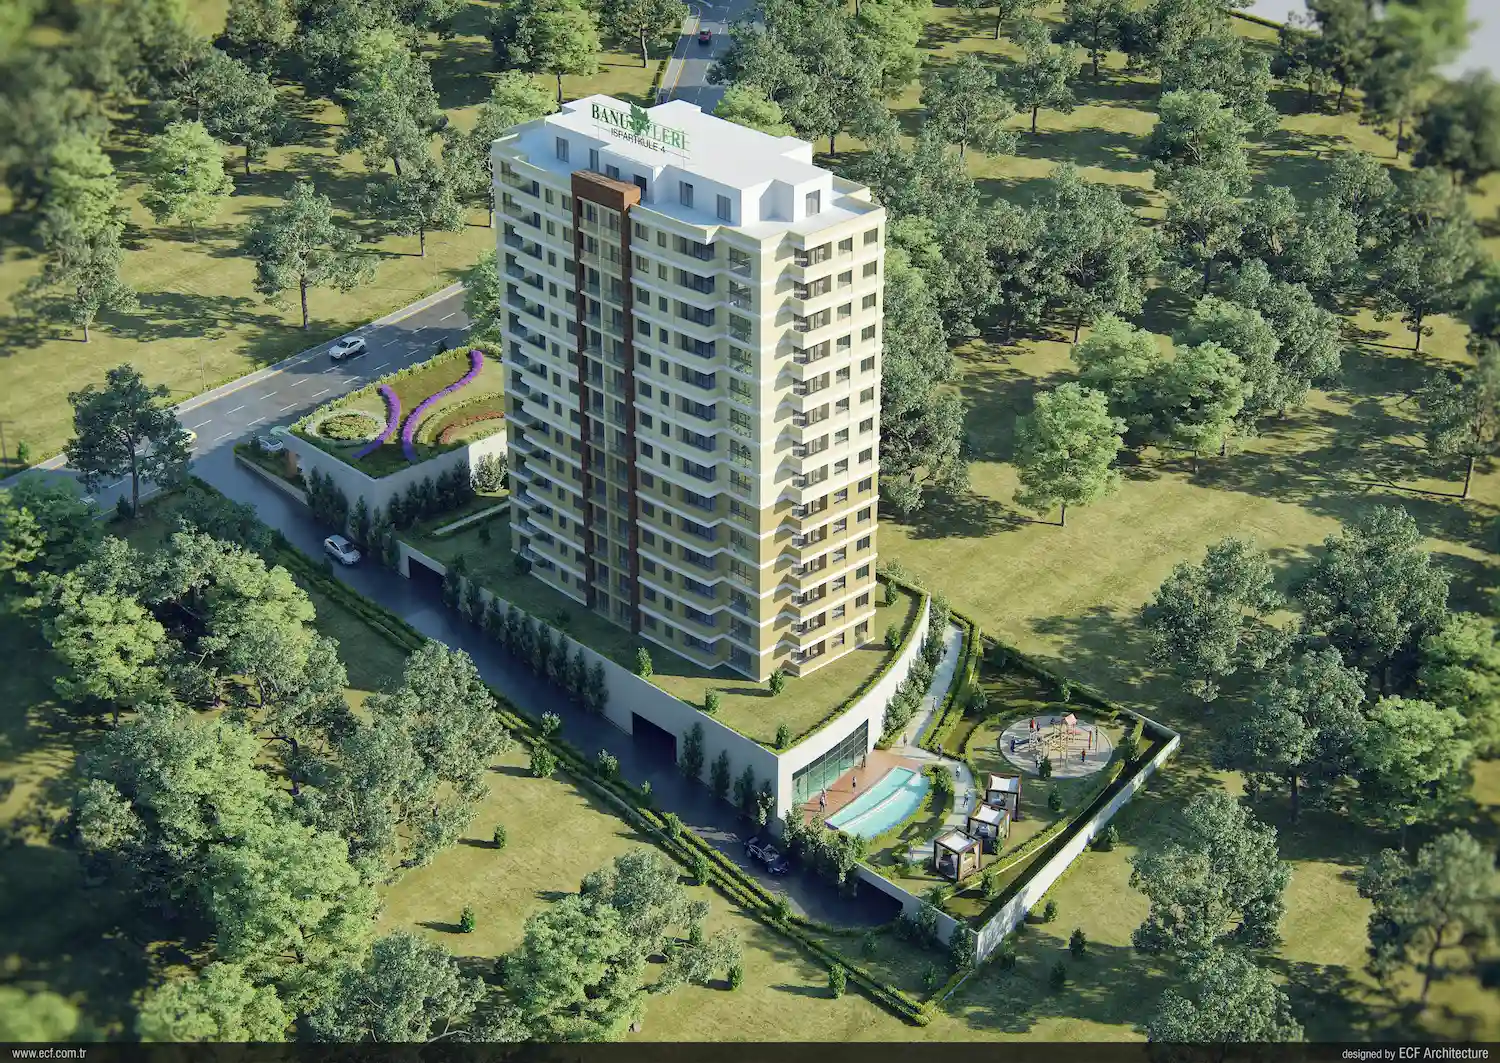
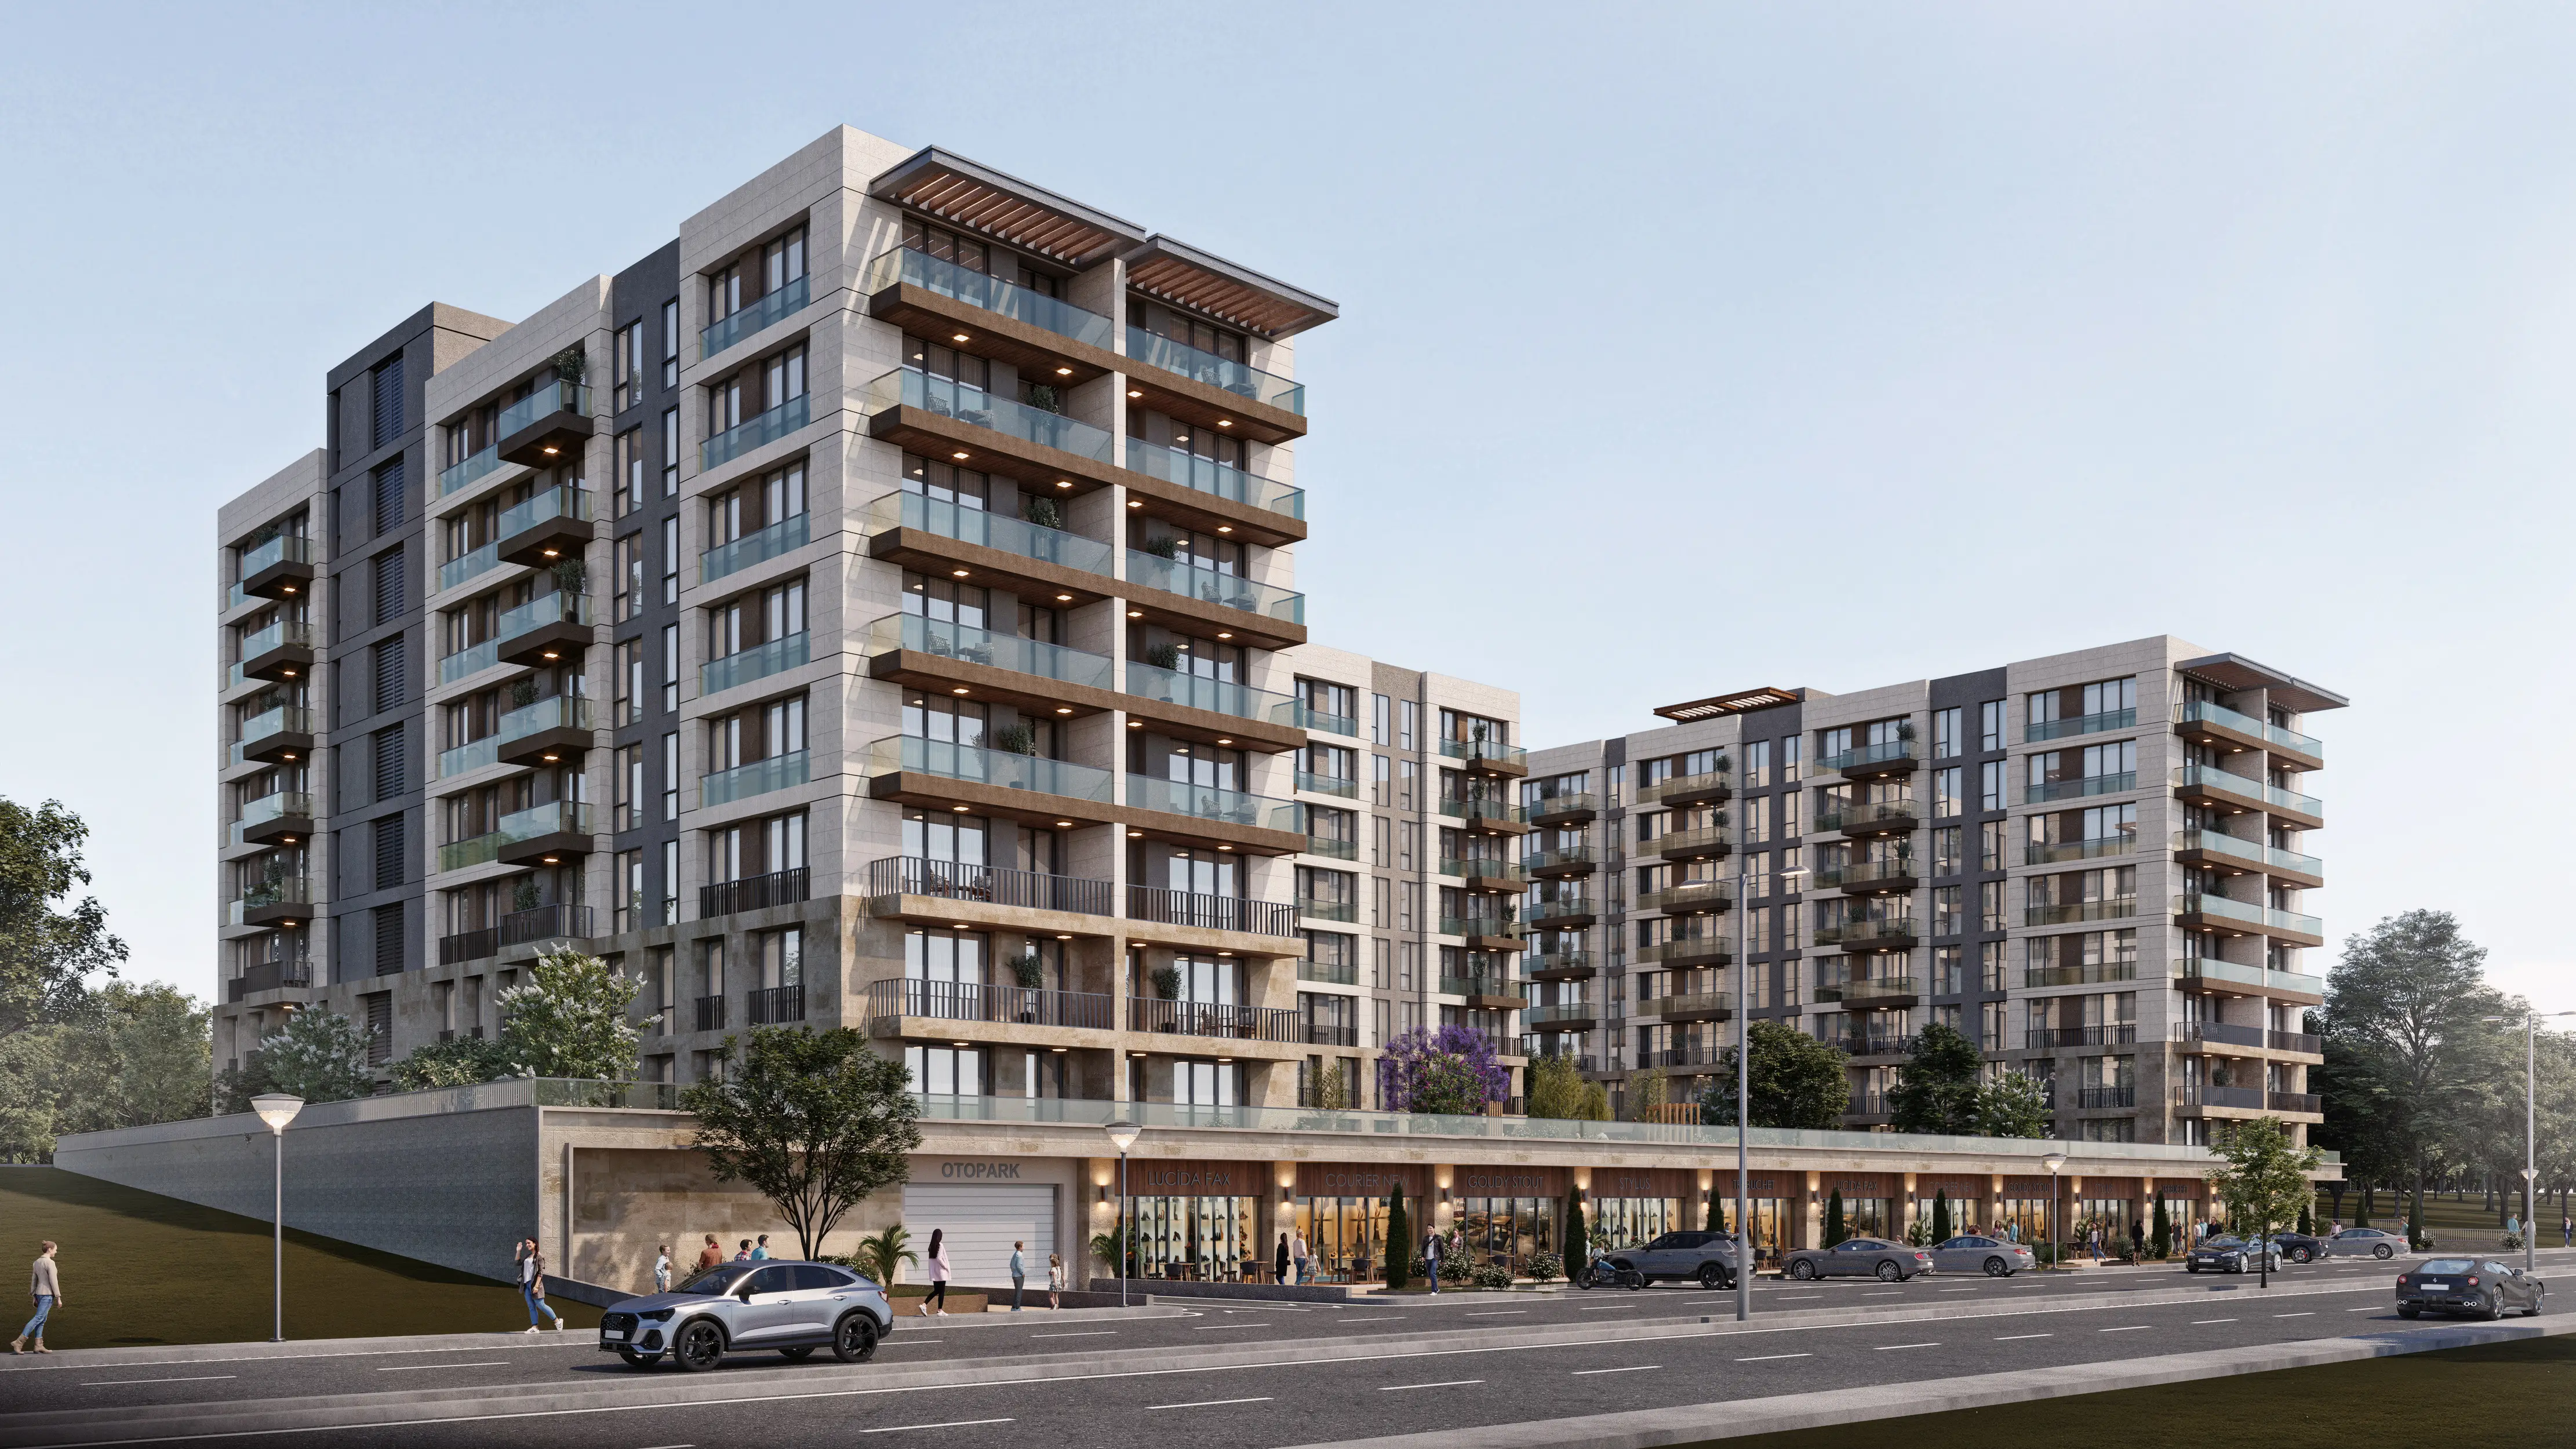
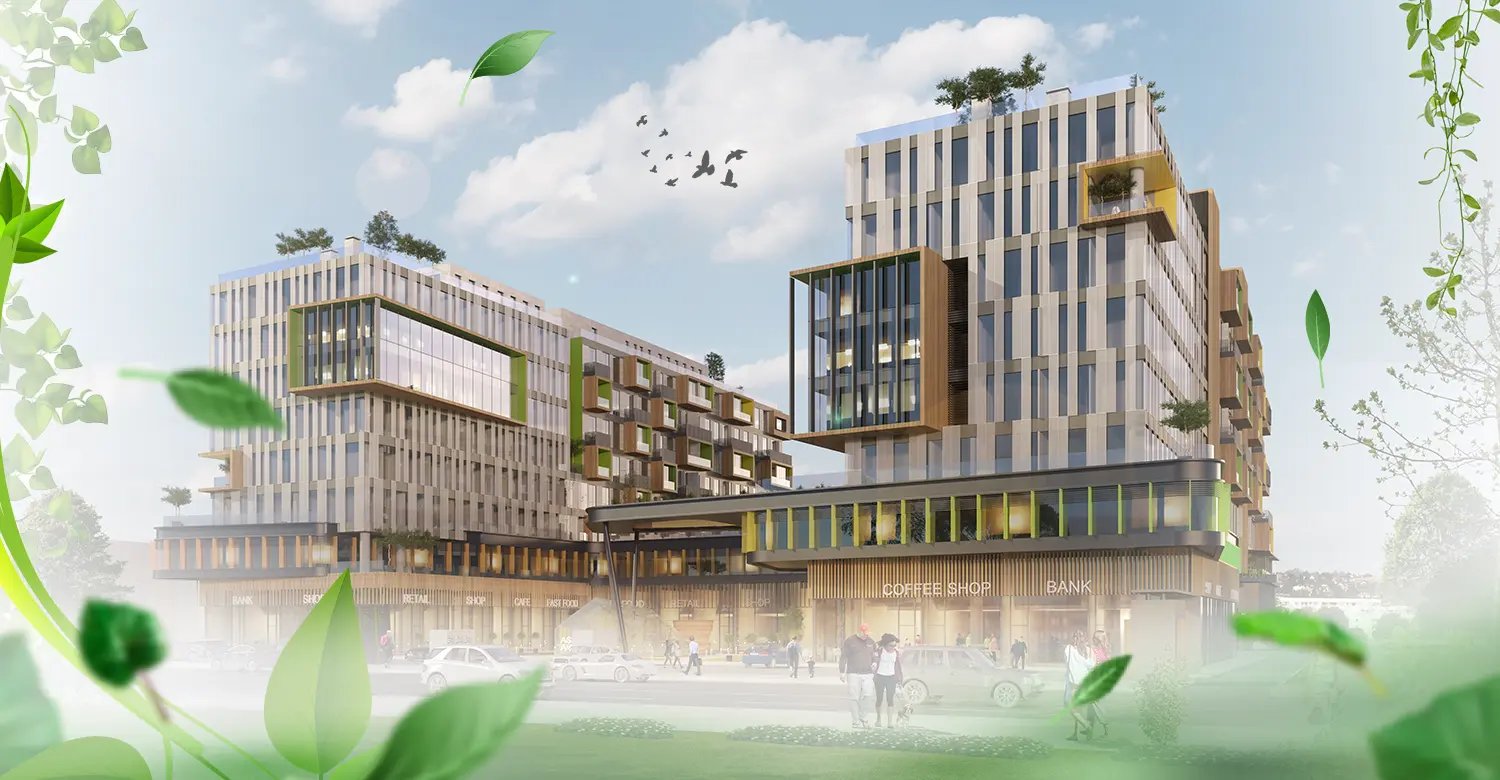
Projects Have same ROI in This Area
.webp)
Have Question Or Suggestion ?
Please Share Your Thought, To Make It Real


