Return on Investment In Turkey
We are providing a financial metric for real estate investors as it helps them to determine the profitability of their real estate investment in Turkey
832€
Average Income
603€ - 1,062€
Min Income - Max Income
745,657€
Cash Price
| Year | Annual Increase | Monthly ROI | Annual ROI |
|---|---|---|---|
| 1 | 1.34 % | 832€ | 9,985€ |
| 2 | 1.67 % | 1,040€ | 12,482€ |
| 3 | 2.09 % | 1,300€ | 15,602€ |
| 4 | 2.62 % | 1,625€ | 19,503€ |
| 5 | 3.27 % | 2,032€ | 24,379€ |
| 6 | 4.09 % | 2,539€ | 30,473€ |
| 7 | 5.11 % | 3,174€ | 38,091€ |
| 8 | 6.39 % | 3,968€ | 47,614€ |
| 9 | 7.98 % | 4,960€ | 59,518€ |
| 10 | 9.98 % | 6,200€ | 74,397€ |
332,045€ 44%
Total ROI For 10 Years
1,062€
Max Income
745,657€
Cash Price
| Year | Annual Increase | Monthly ROI | Annual ROI |
|---|---|---|---|
| 1 | 1.71 % | 1,062€ | 12,740€ |
| 2 | 2.14 % | 1,327€ | 15,925€ |
| 3 | 2.67 % | 1,659€ | 19,906€ |
| 4 | 3.34 % | 2,074€ | 24,883€ |
| 5 | 4.17 % | 2,592€ | 31,104€ |
| 6 | 5.21 % | 3,240€ | 38,880€ |
| 7 | 6.52 % | 4,050€ | 48,599€ |
| 8 | 8.15 % | 5,062€ | 60,749€ |
| 9 | 10.18 % | 6,328€ | 75,937€ |
| 10 | 12.73 % | 7,910€ | 94,921€ |
423,643€ 56%
Total ROI For 10 Years
603€
Min Income
745,657€
Cash Price
| Year | Annual Increase | Monthly ROI | Annual ROI |
|---|---|---|---|
| 1 | 0.97 % | 603€ | 7,231€ |
| 2 | 1.21 % | 753€ | 9,039€ |
| 3 | 1.52 % | 942€ | 11,298€ |
| 4 | 1.89 % | 1,177€ | 14,123€ |
| 5 | 2.37 % | 1,471€ | 17,653€ |
| 6 | 2.96 % | 1,839€ | 22,067€ |
| 7 | 3.70 % | 2,299€ | 27,583€ |
| 8 | 4.62 % | 2,873€ | 34,479€ |
| 9 | 5.78 % | 3,592€ | 43,099€ |
| 10 | 7.23 % | 4,489€ | 53,874€ |
240,446€ 32%
Total ROI For 10 Years
District Classification
Rating
A-
Area map
Statistics
Population
745,125
Social Status
Married : 62%
Unmarried : 30%
area
22 Km2
Price Changes Over Last 5 Years
1 Year Change
13.59%
3 Year Change
263.6%
5 Year Change
273.2%
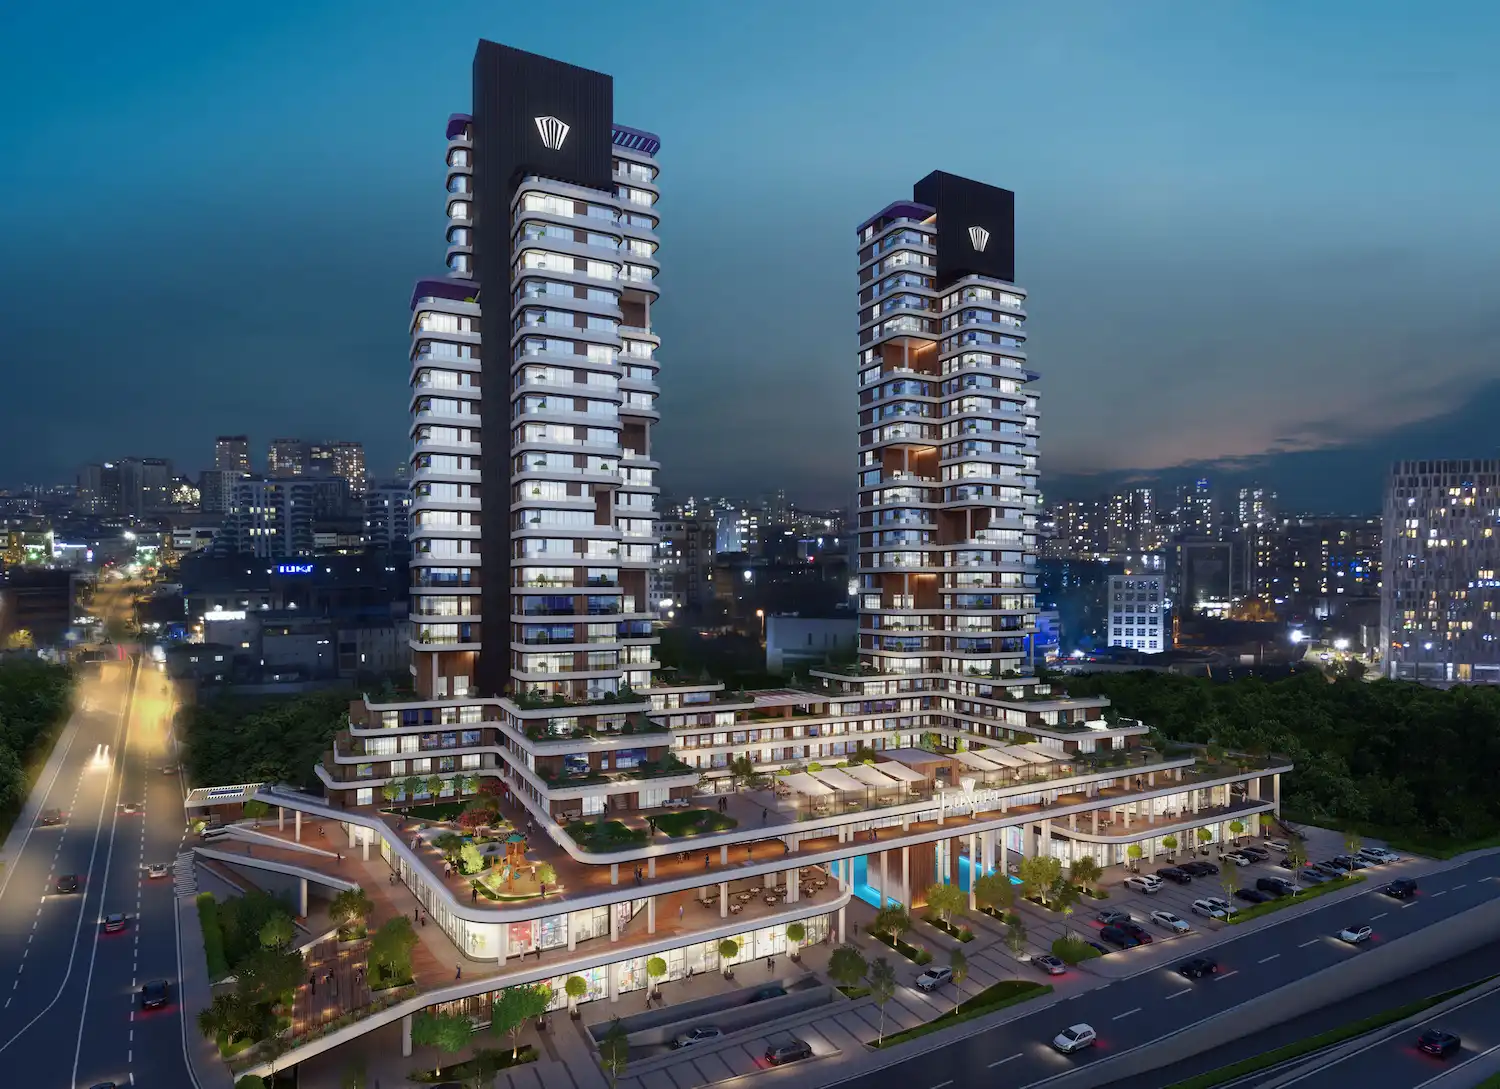
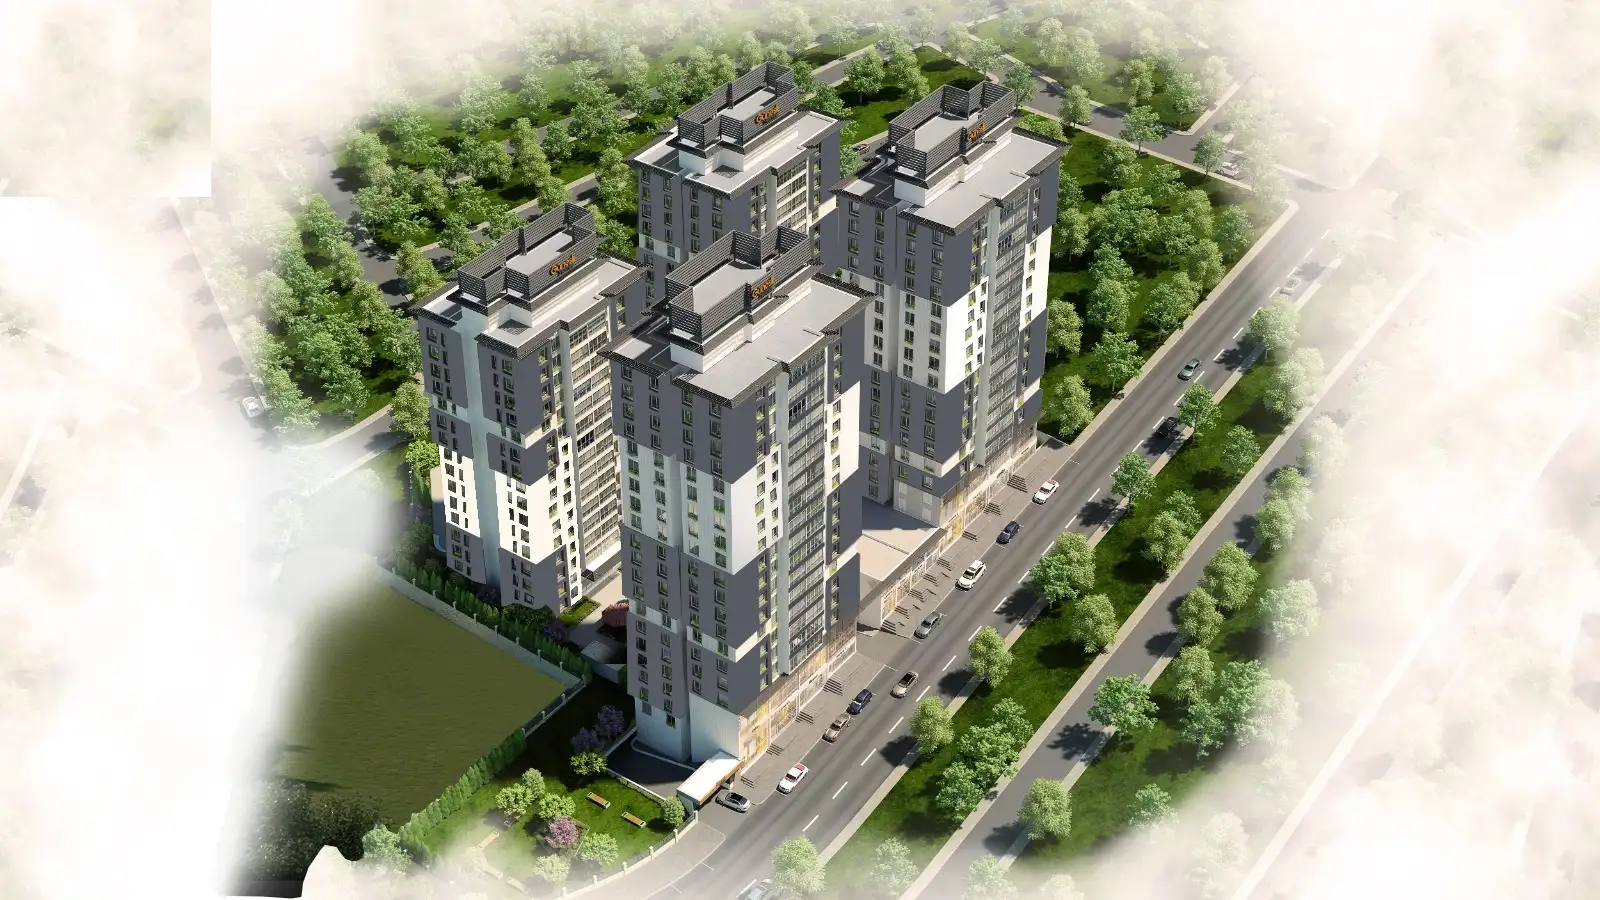
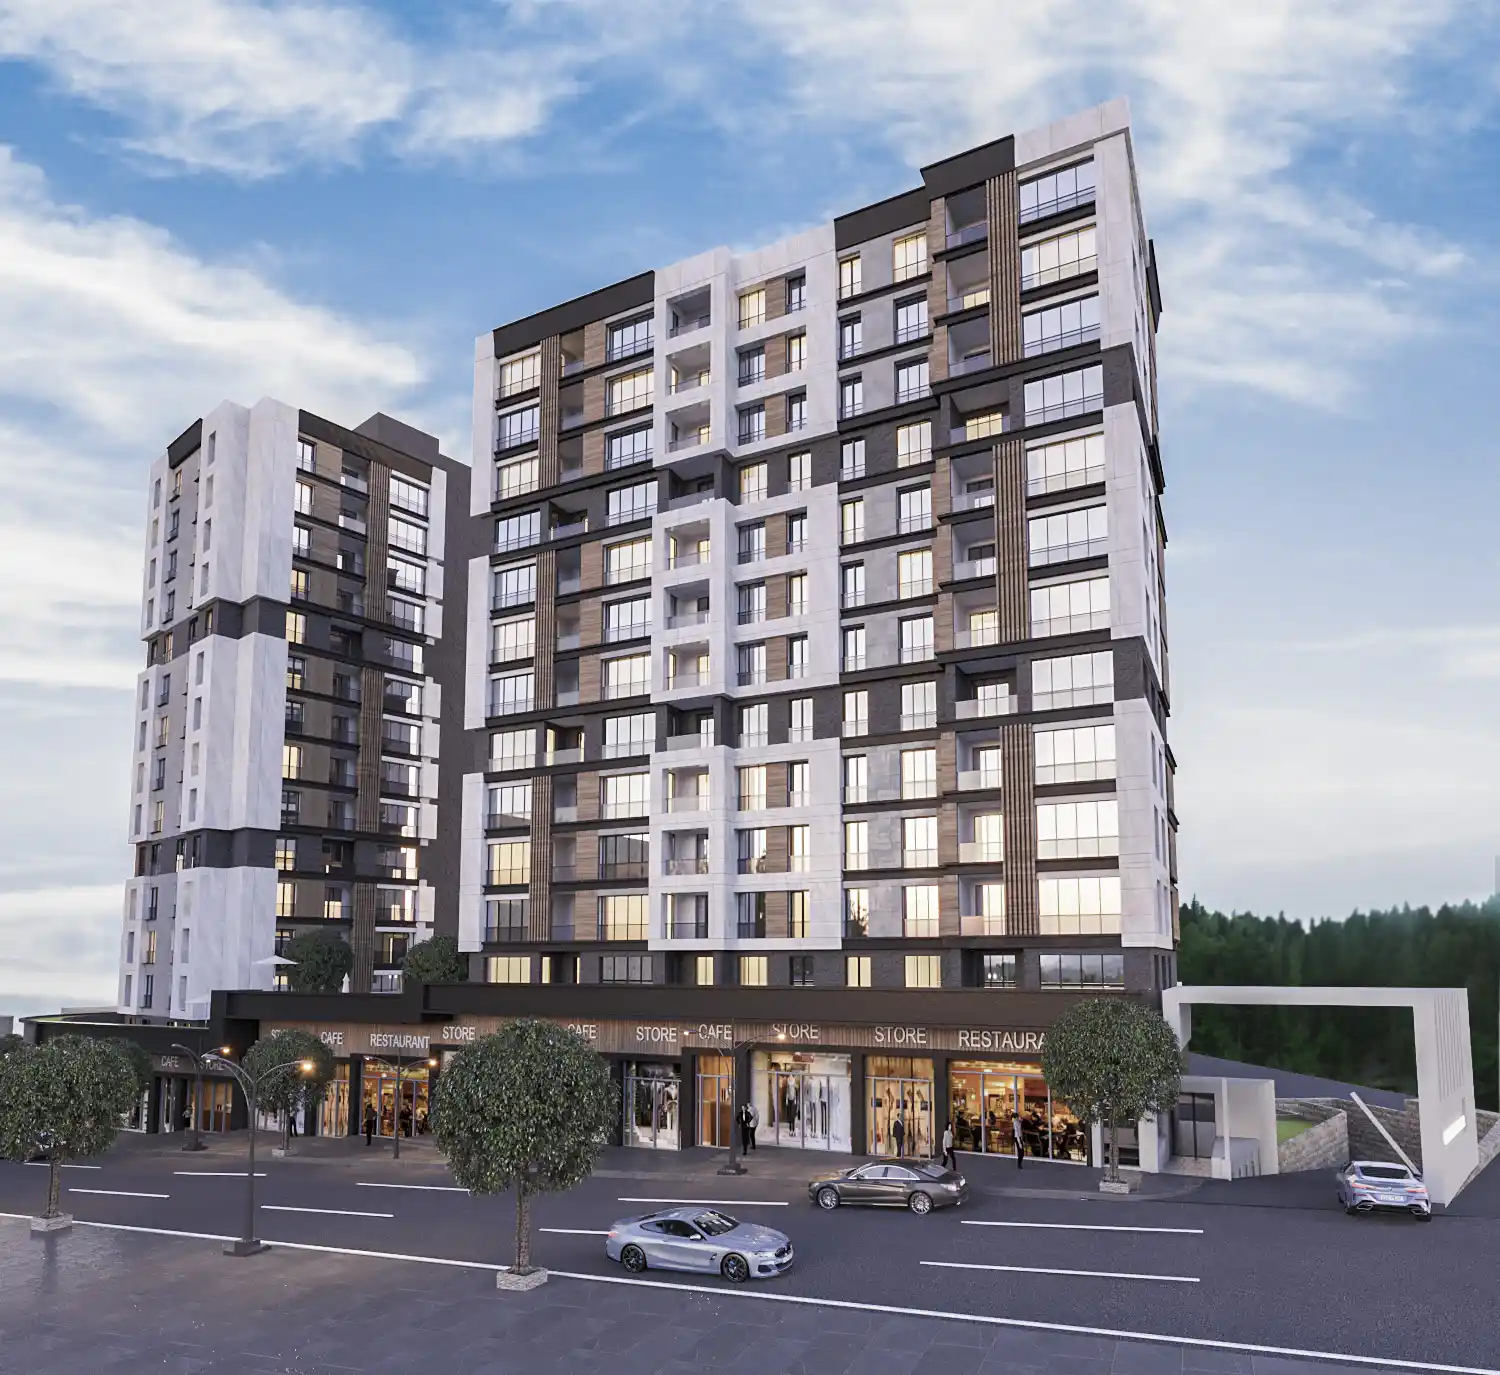
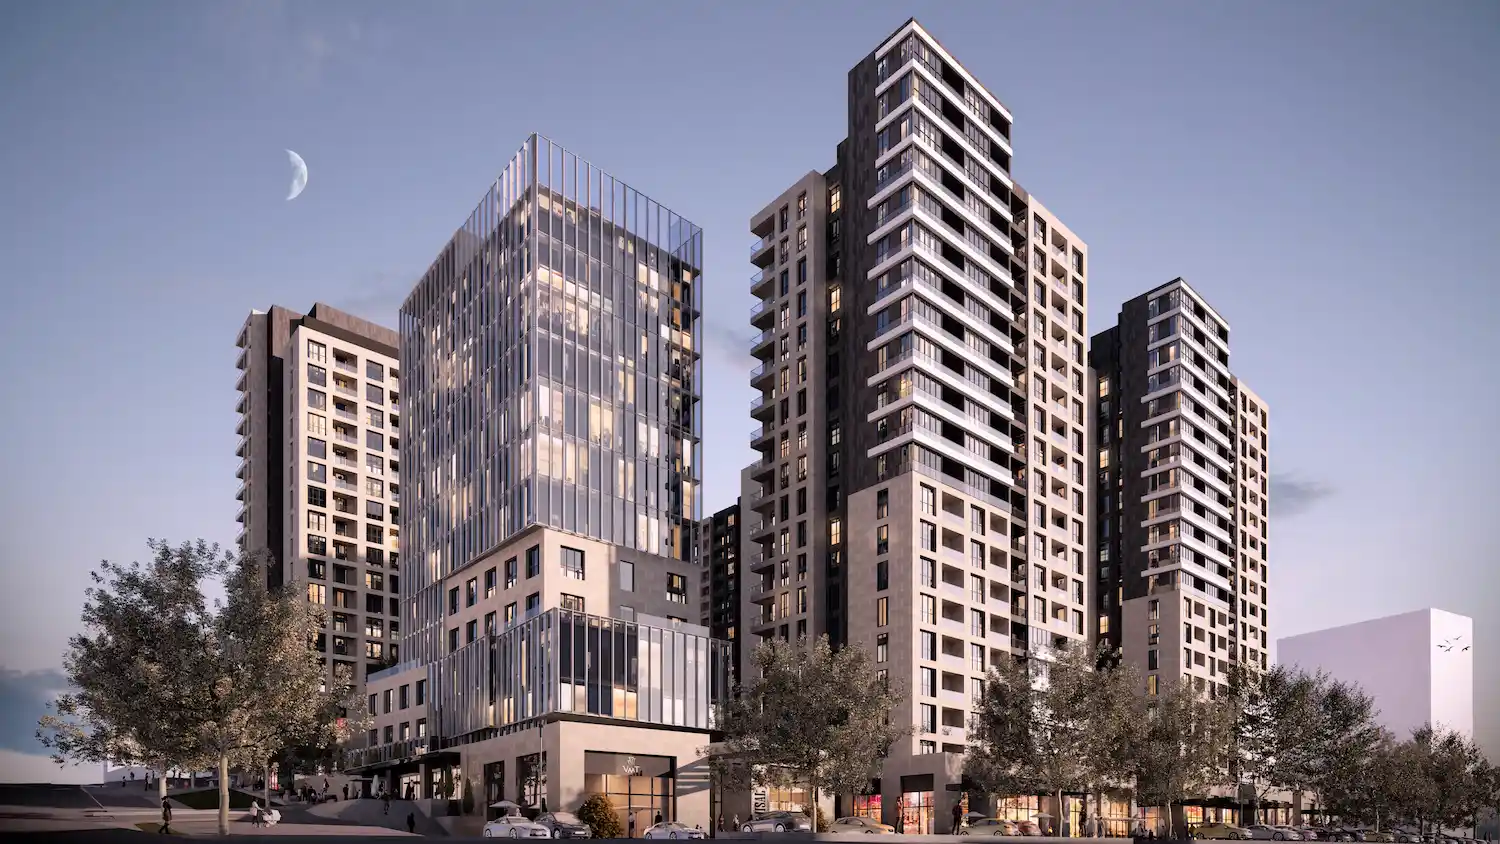
Projects Have same ROI in This Area
Have Question Or Suggestion ?
Please Share Your Thought, To Make It Real

.webp)

.webp)
