Return on Investment In Turkey
We are providing a financial metric for real estate investors as it helps them to determine the profitability of their real estate investment in Turkey
633$
Average Income
463$ - 803$
Min Income - Max Income
42,178$
Cash Price
| Year | Annual Increase | Monthly ROI | Annual ROI |
|---|---|---|---|
| 1 | 18.01 % | 633$ | 7,597$ |
| 2 | 22.52 % | 791$ | 9,497$ |
| 3 | 28.14 % | 989$ | 11,871$ |
| 4 | 35.18 % | 1,237$ | 14,838$ |
| 5 | 43.98 % | 1,546$ | 18,548$ |
| 6 | 54.97 % | 1,932$ | 23,185$ |
| 7 | 68.71 % | 2,415$ | 28,981$ |
| 8 | 85.89 % | 3,019$ | 36,226$ |
| 9 | 107.36 % | 3,774$ | 45,283$ |
| 10 | 134.20 % | 4,717$ | 56,604$ |
252,630$ 598%
Total ROI For 10 Years
803$
Max Income
42,178$
Cash Price
| Year | Annual Increase | Monthly ROI | Annual ROI |
|---|---|---|---|
| 1 | 22.84 % | 803$ | 9,636$ |
| 2 | 28.56 % | 1,004$ | 12,044$ |
| 3 | 35.70 % | 1,255$ | 15,056$ |
| 4 | 44.62 % | 1,568$ | 18,819$ |
| 5 | 55.77 % | 1,960$ | 23,524$ |
| 6 | 69.72 % | 2,450$ | 29,405$ |
| 7 | 87.15 % | 3,063$ | 36,757$ |
| 8 | 108.93 % | 3,829$ | 45,946$ |
| 9 | 136.17 % | 4,786$ | 57,432$ |
| 10 | 170.21 % | 5,983$ | 71,790$ |
320,409$ 759%
Total ROI For 10 Years
463$
Min Income
42,178$
Cash Price
| Year | Annual Increase | Monthly ROI | Annual ROI |
|---|---|---|---|
| 1 | 13.18 % | 463$ | 5,559$ |
| 2 | 16.47 % | 579$ | 6,949$ |
| 3 | 20.59 % | 724$ | 8,686$ |
| 4 | 25.74 % | 905$ | 10,857$ |
| 5 | 32.18 % | 1,131$ | 13,572$ |
| 6 | 40.22 % | 1,414$ | 16,965$ |
| 7 | 50.28 % | 1,767$ | 21,206$ |
| 8 | 62.85 % | 2,209$ | 26,507$ |
| 9 | 78.56 % | 2,761$ | 33,134$ |
| 10 | 98.20 % | 3,451$ | 41,417$ |
184,851$ 438%
Total ROI For 10 Years
District Classification
Rating
a+
Area map
Statistics
Population
323,211
Social Status
Married : 55%
Unmarried : 45%
area
5 Km2
Price Changes Over Last 5 Years
1 Year Change
13.62%
3 Year Change
425.8%
5 Year Change
448.2%
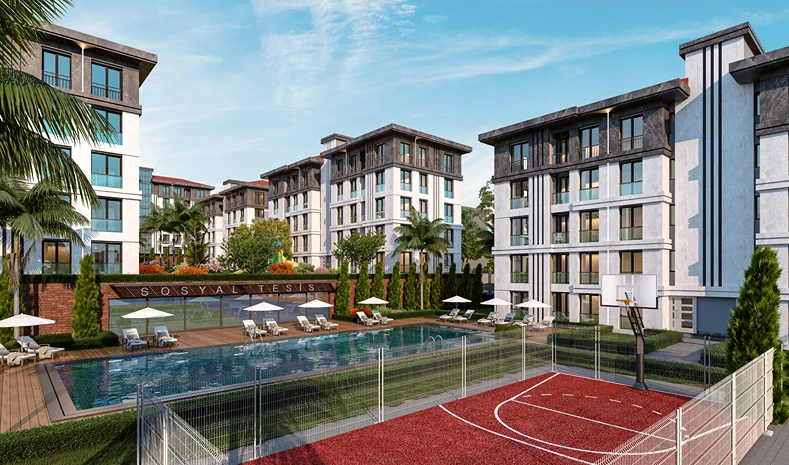
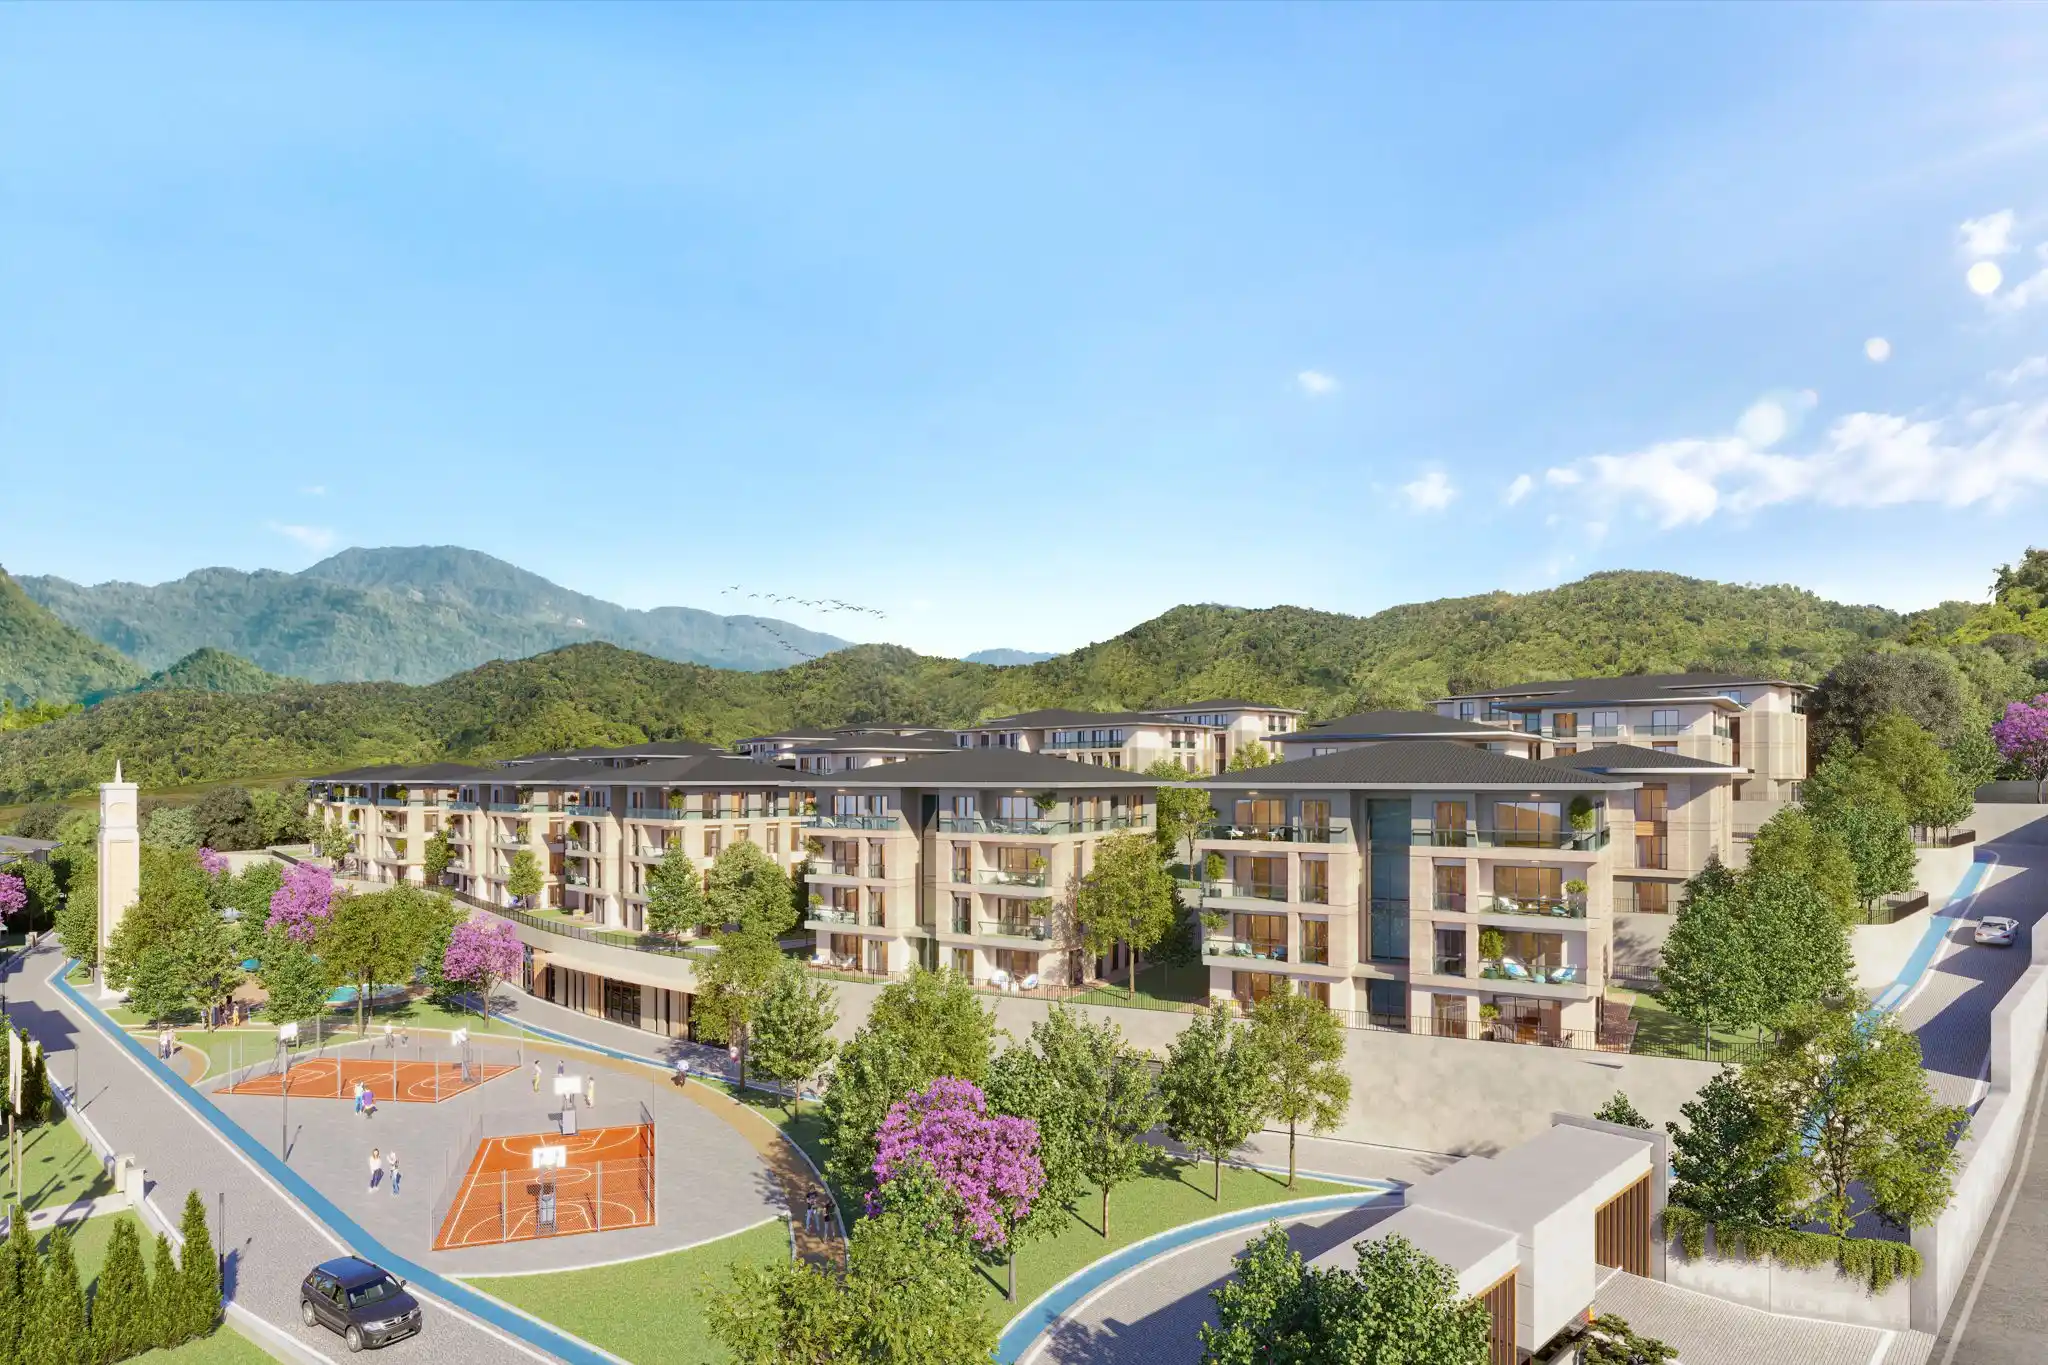
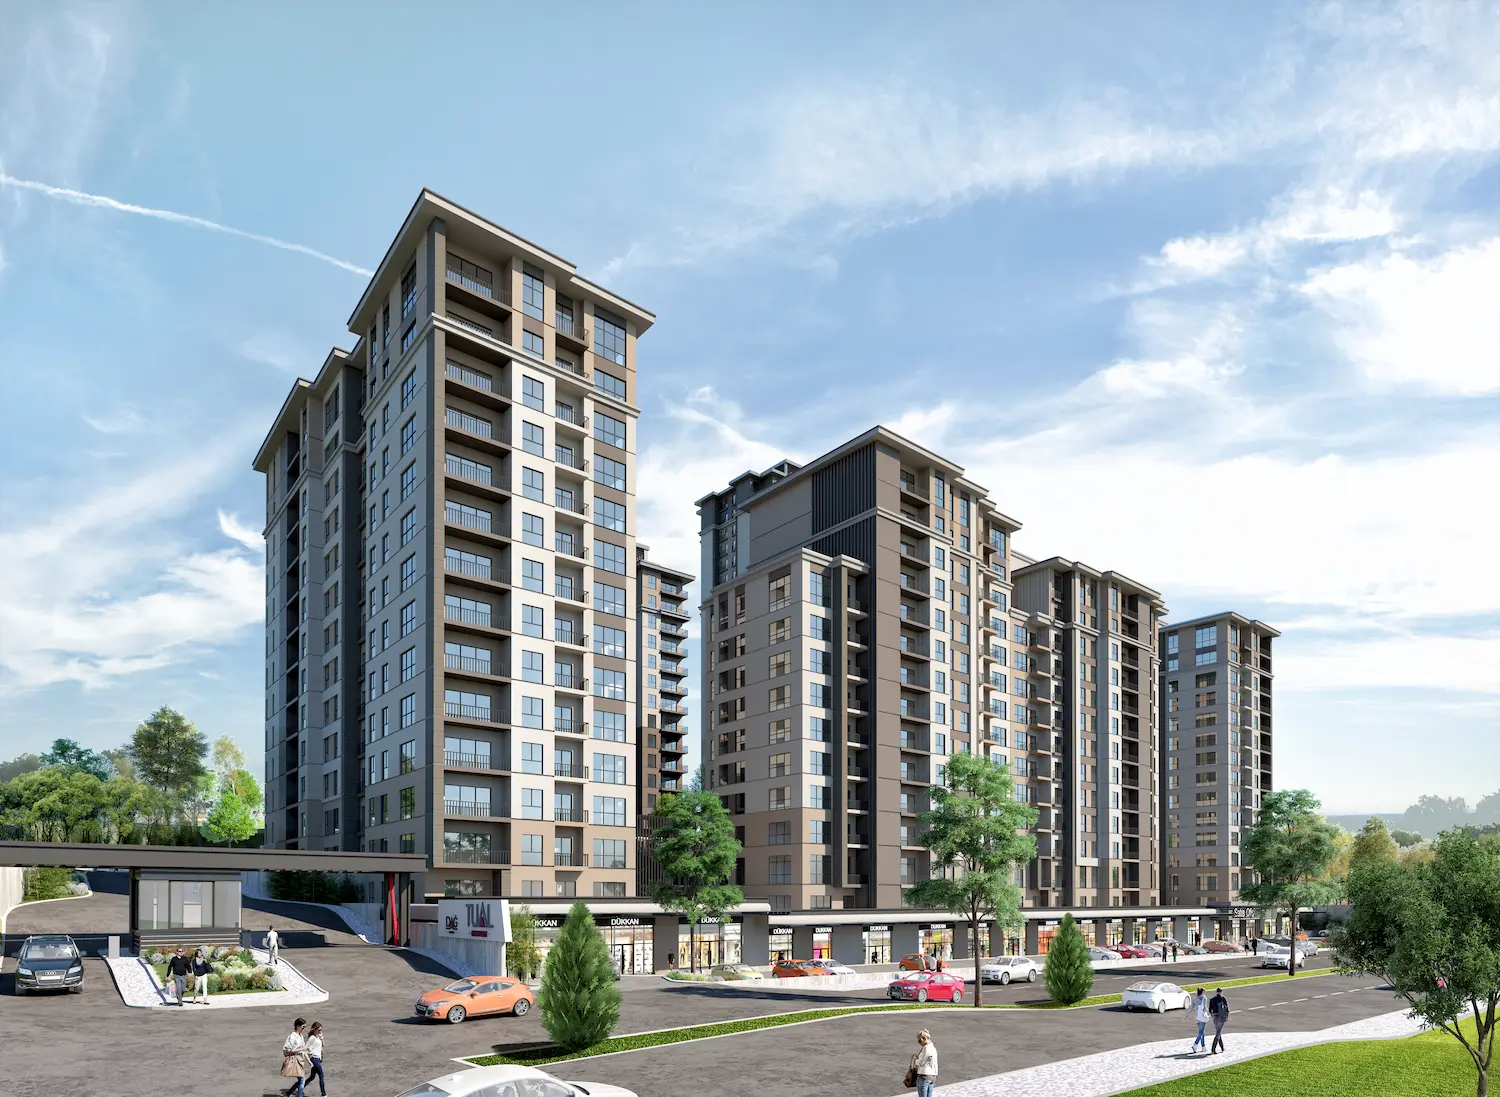
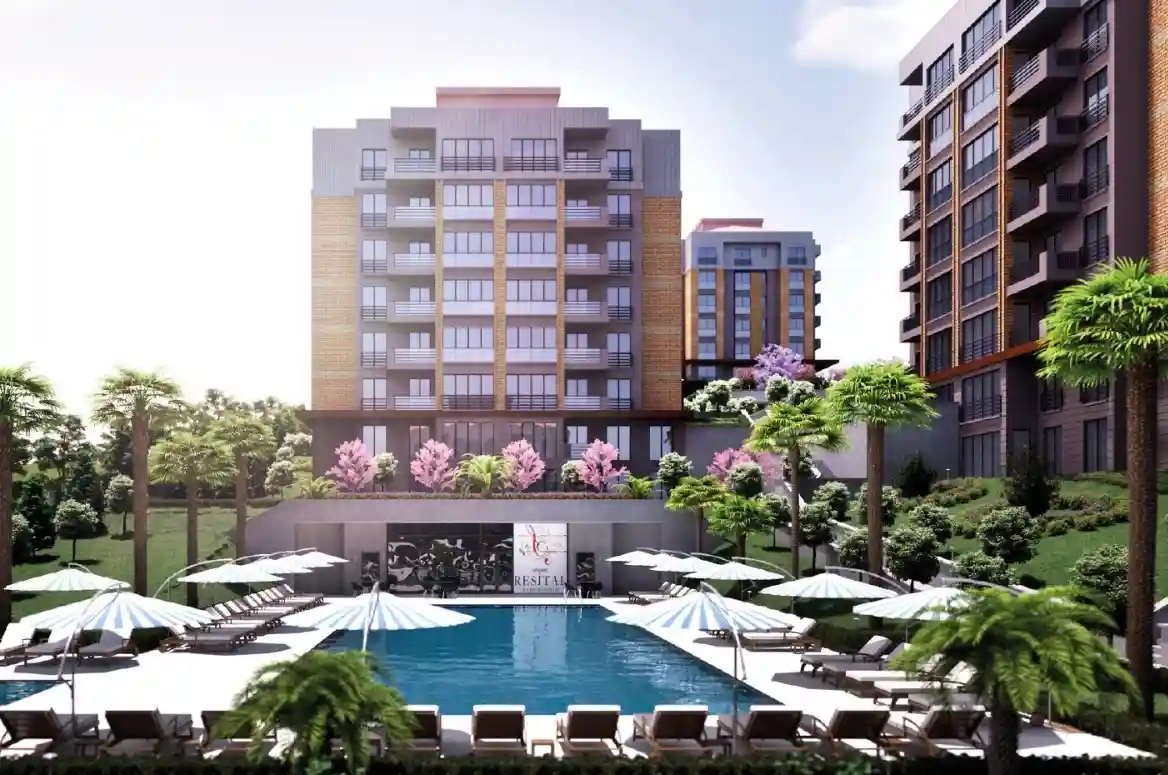
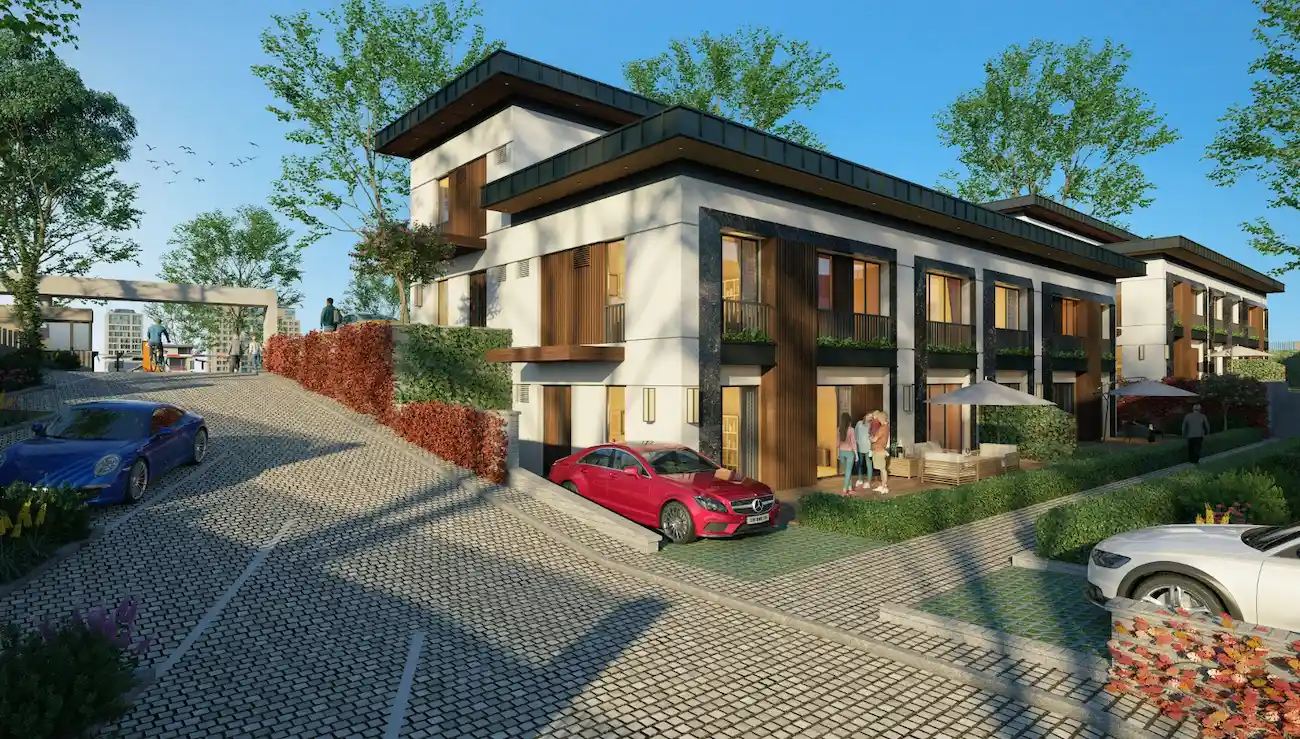
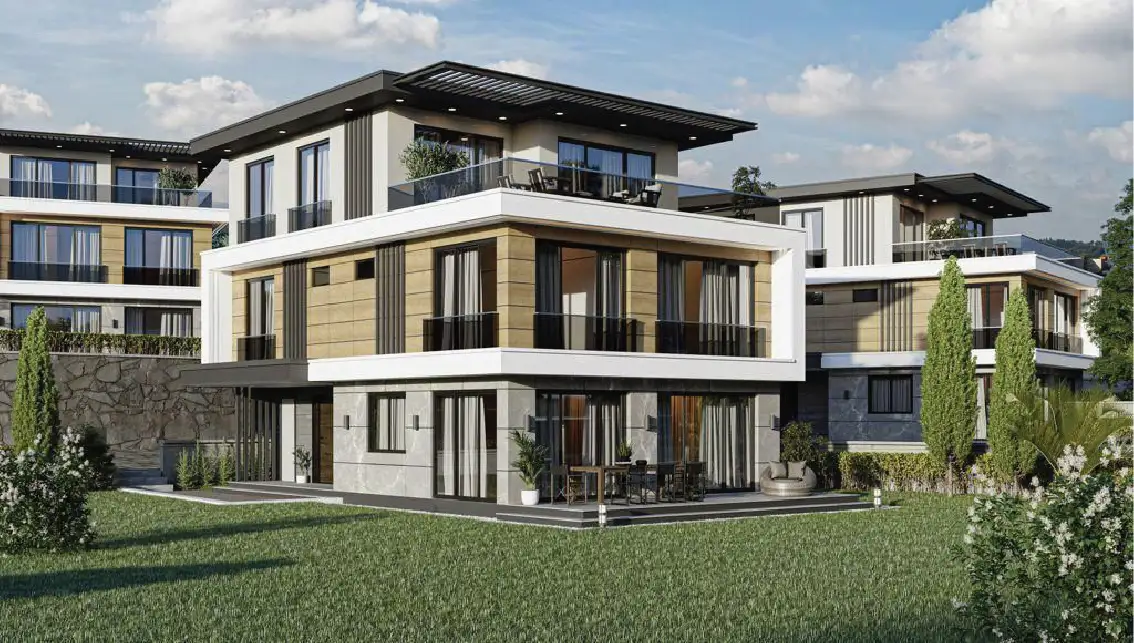
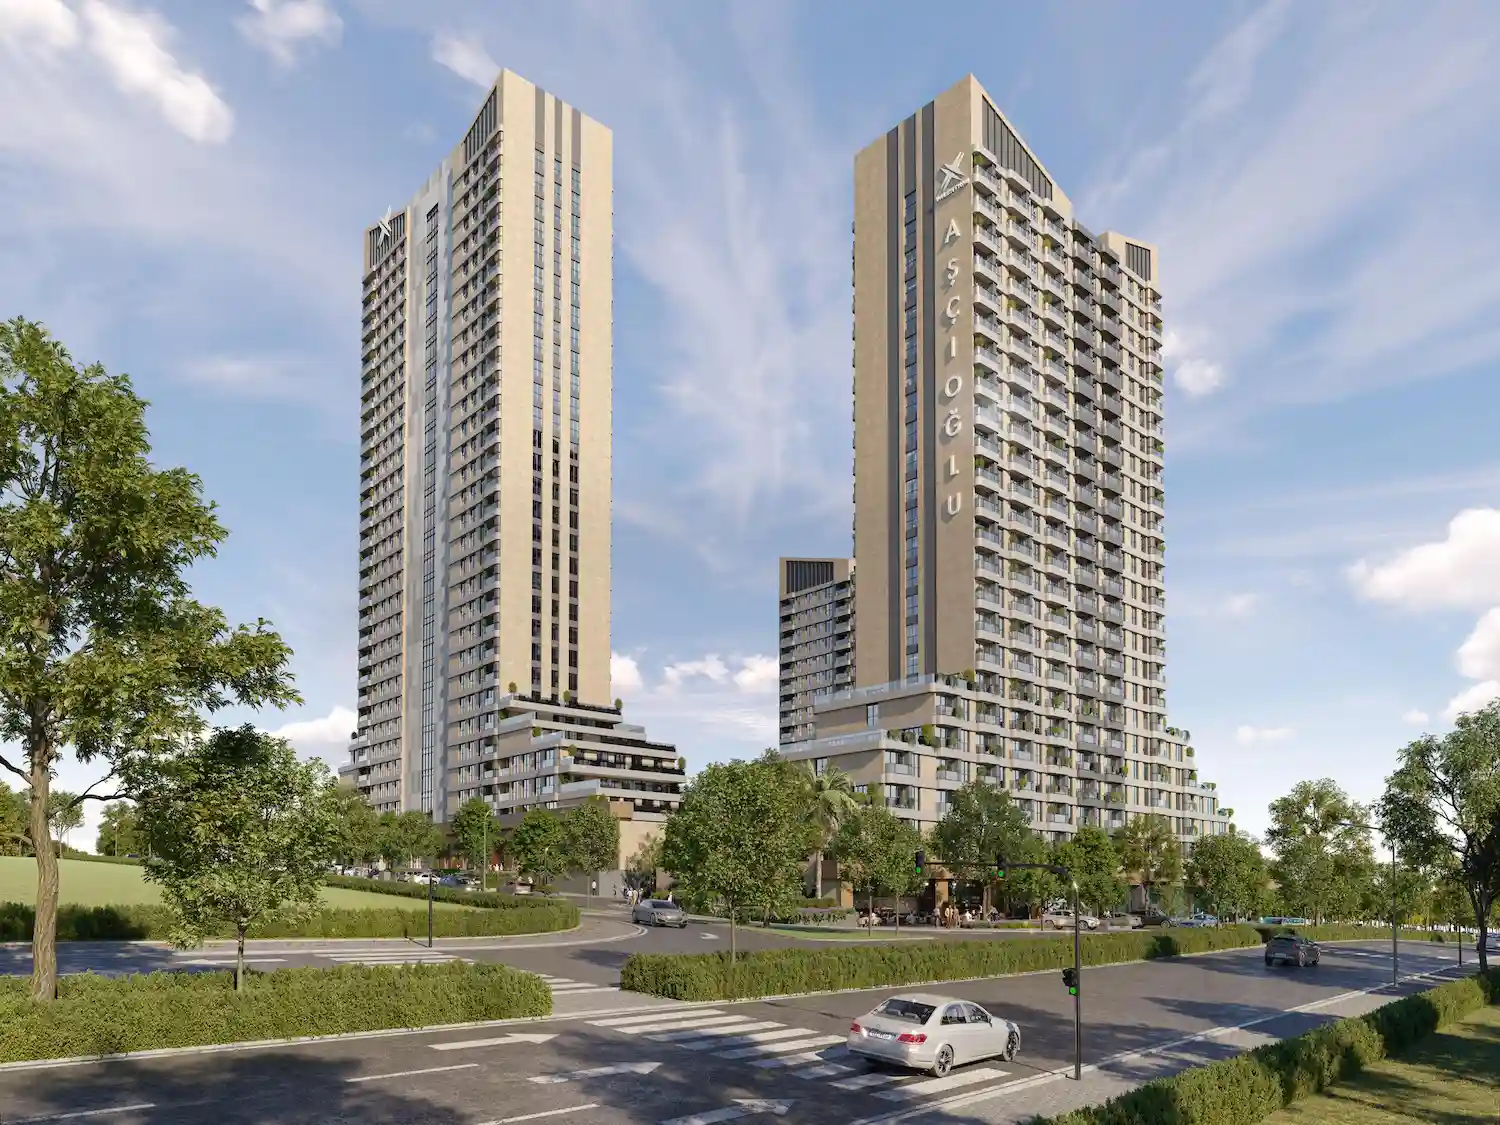
Projects Have same ROI in This Area
.webp)


Have Question Or Suggestion ?
Please Share Your Thought, To Make It Real


