Return on Investment In Turkey
We are providing a financial metric for real estate investors as it helps them to determine the profitability of their real estate investment in Turkey
1,783$
Average Income
1,396$ - 2,171$
Min Income - Max Income
432,779$
Cash Price
| Year | Annual Increase | Monthly ROI | Annual ROI |
|---|---|---|---|
| 1 | 4.94 % | 1,783$ | 21,400$ |
| 2 | 6.18 % | 2,229$ | 26,750$ |
| 3 | 7.73 % | 2,786$ | 33,437$ |
| 4 | 9.66 % | 3,483$ | 41,796$ |
| 5 | 12.07 % | 4,354$ | 52,245$ |
| 6 | 15.09 % | 5,442$ | 65,307$ |
| 7 | 18.86 % | 6,803$ | 81,633$ |
| 8 | 23.58 % | 8,503$ | 102,042$ |
| 9 | 29.47 % | 10,629$ | 127,552$ |
| 10 | 36.84 % | 13,287$ | 159,440$ |
711,603$ 164%
Total ROI For 10 Years
2,171$
Max Income
432,779$
Cash Price
| Year | Annual Increase | Monthly ROI | Annual ROI |
|---|---|---|---|
| 1 | 6.02 % | 2,171$ | 26,052$ |
| 2 | 7.52 % | 2,714$ | 32,565$ |
| 3 | 9.41 % | 3,392$ | 40,706$ |
| 4 | 11.76 % | 4,240$ | 50,883$ |
| 5 | 14.70 % | 5,300$ | 63,603$ |
| 6 | 18.37 % | 6,625$ | 79,504$ |
| 7 | 22.96 % | 8,282$ | 99,380$ |
| 8 | 28.70 % | 10,352$ | 124,225$ |
| 9 | 35.88 % | 12,940$ | 155,281$ |
| 10 | 44.85 % | 16,175$ | 194,101$ |
866,299$ 200%
Total ROI For 10 Years
1,396$
Min Income
432,779$
Cash Price
| Year | Annual Increase | Monthly ROI | Annual ROI |
|---|---|---|---|
| 1 | 3.87 % | 1,396$ | 16,748$ |
| 2 | 4.84 % | 1,745$ | 20,935$ |
| 3 | 6.05 % | 2,181$ | 26,168$ |
| 4 | 7.56 % | 2,726$ | 32,710$ |
| 5 | 9.45 % | 3,407$ | 40,888$ |
| 6 | 11.81 % | 4,259$ | 51,110$ |
| 7 | 14.76 % | 5,324$ | 63,887$ |
| 8 | 18.45 % | 6,655$ | 79,859$ |
| 9 | 23.07 % | 8,319$ | 99,824$ |
| 10 | 28.83 % | 10,398$ | 124,779$ |
556,907$ 128%
Total ROI For 10 Years
District Classification
Rating
b+
Area map
Statistics
Population
381,110
Social Status
Married : 67%
Unmarried : 26%
area
230 Km2
Price Changes Over Last 5 Years
1 Year Change
17.79%
3 Year Change
202%
5 Year Change
253%
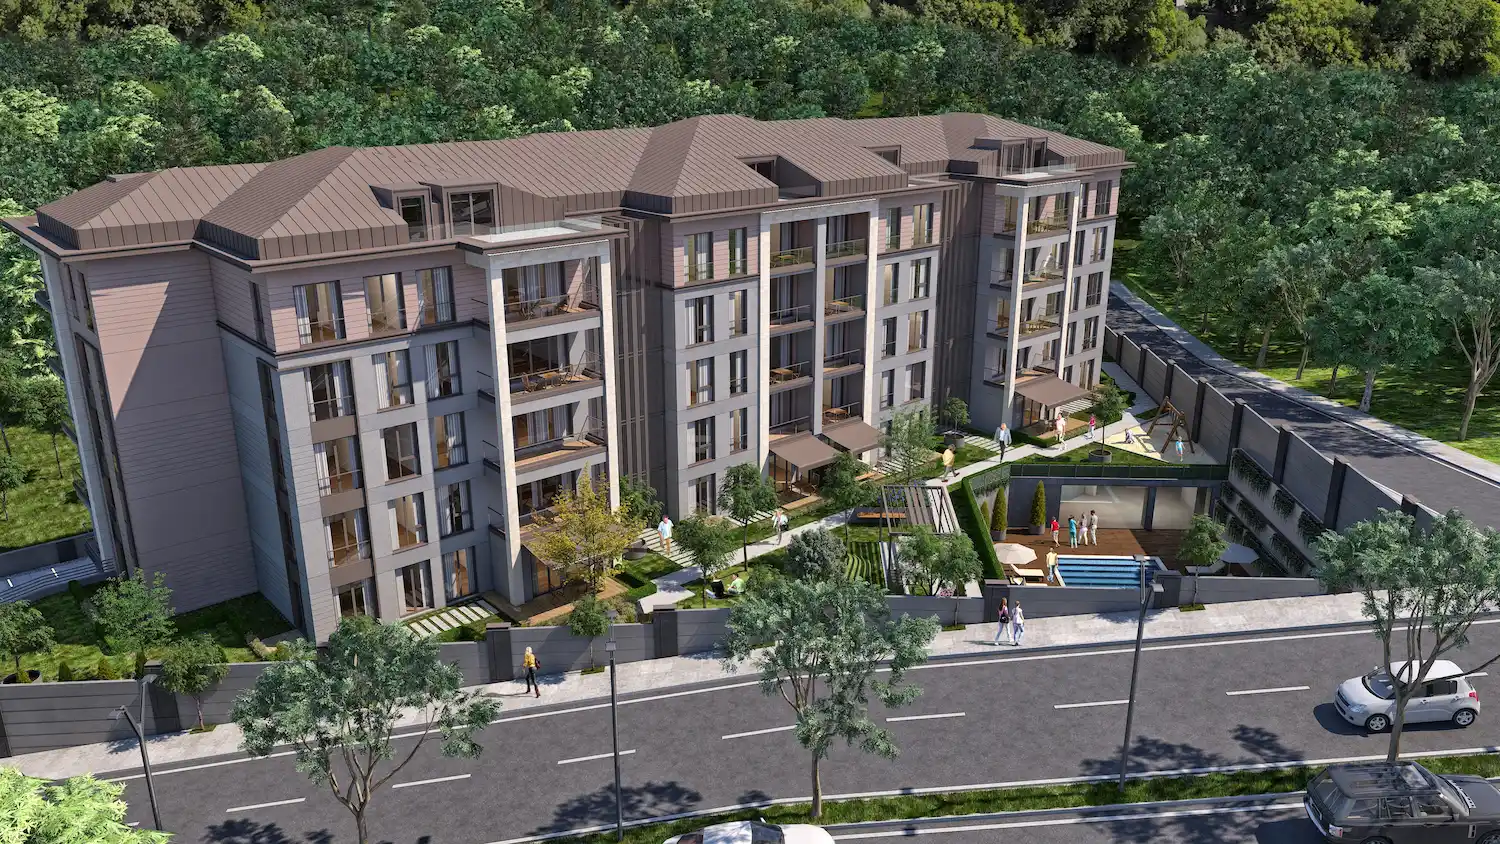
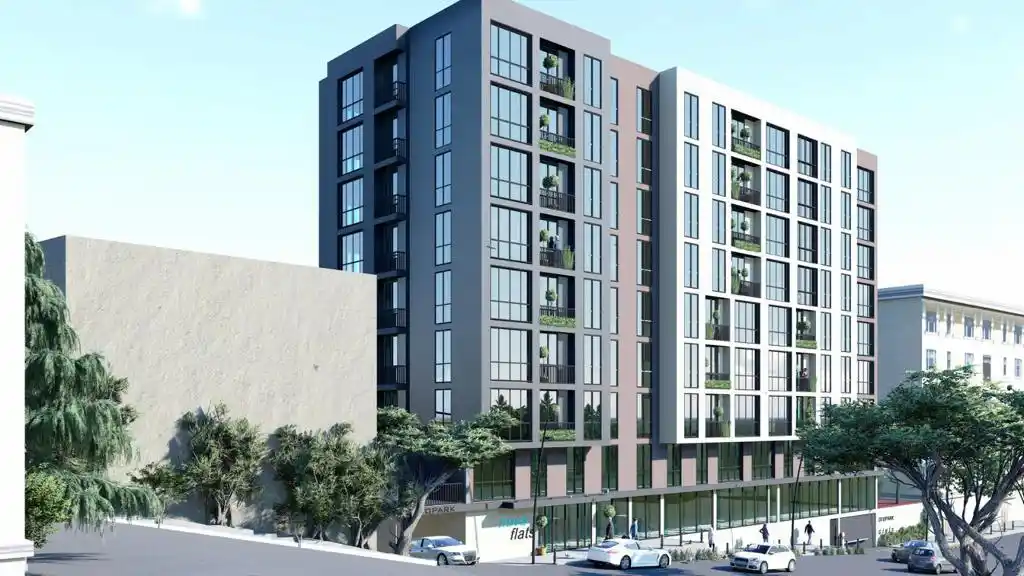
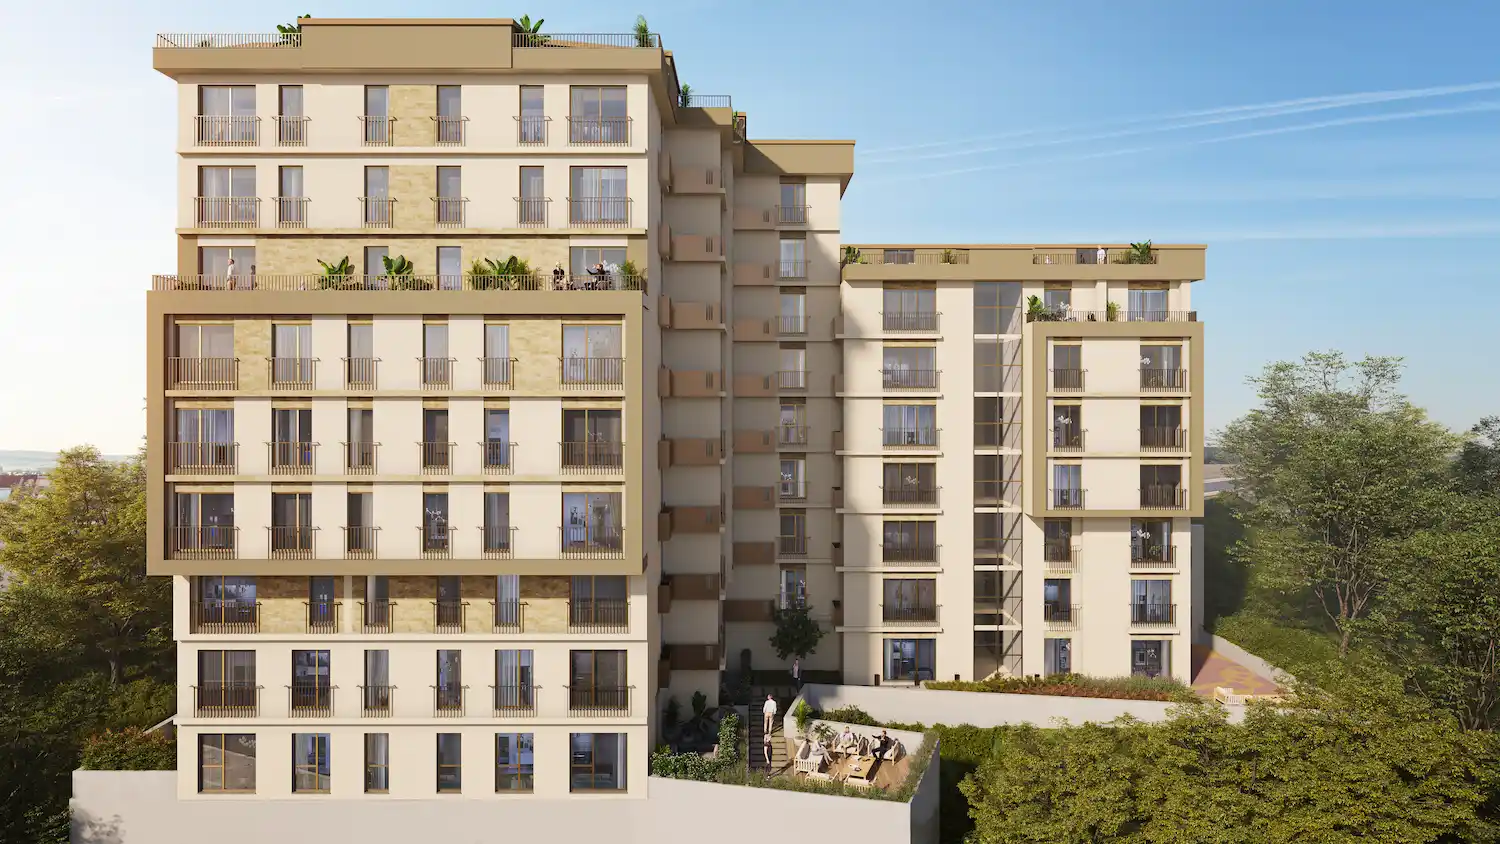
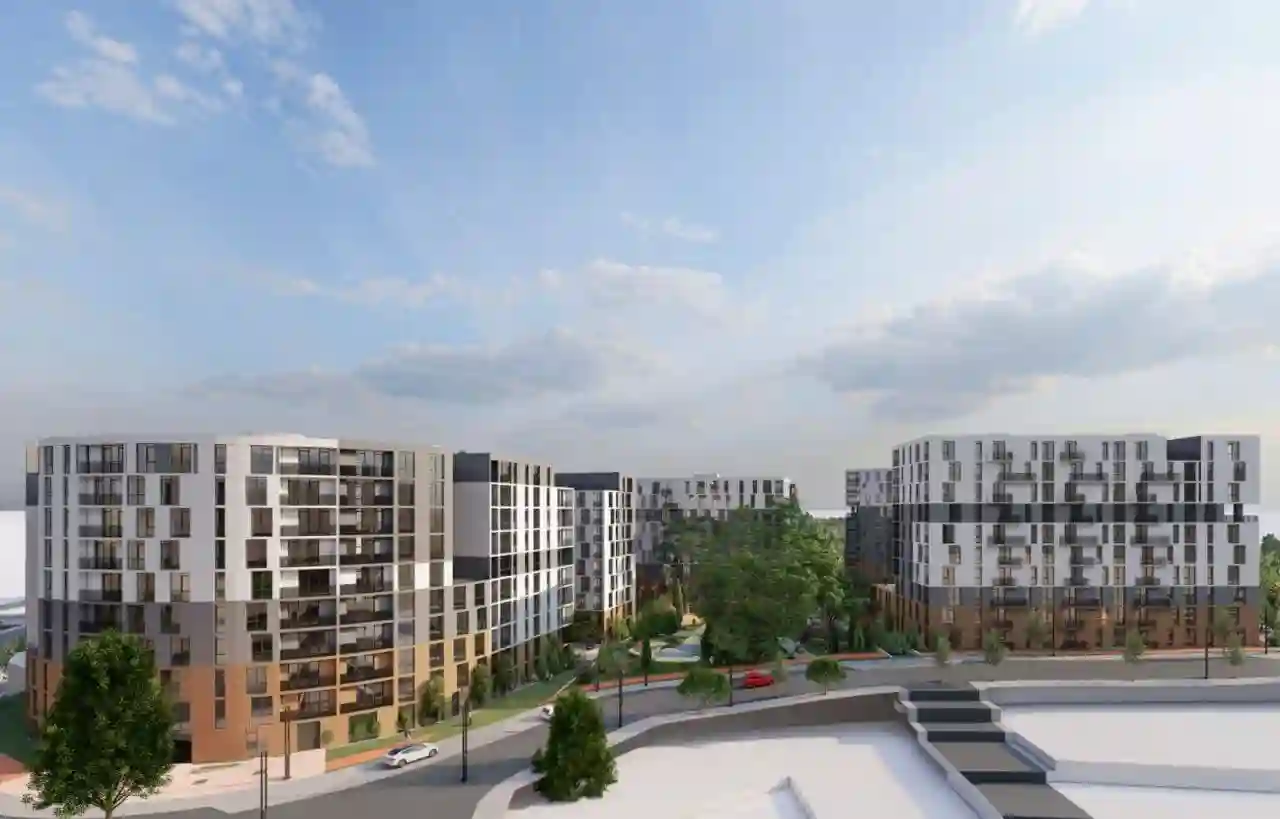
Projects Have same ROI in This Area


Have Question Or Suggestion ?
Please Share Your Thought, To Make It Real


