Return on Investment In Turkey
We are providing a financial metric for real estate investors as it helps them to determine the profitability of their real estate investment in Turkey
3,176$
Average Income
2,014$ - 4,337$
Min Income - Max Income
347,713$
Cash Price
| Year | Annual Increase | Monthly ROI | Annual ROI |
|---|---|---|---|
| 1 | 10.96 % | 3,176$ | 38,106$ |
| 2 | 13.70 % | 3,969$ | 47,633$ |
| 3 | 17.12 % | 4,962$ | 59,541$ |
| 4 | 21.40 % | 6,202$ | 74,426$ |
| 5 | 26.76 % | 7,753$ | 93,033$ |
| 6 | 33.44 % | 9,691$ | 116,291$ |
| 7 | 41.81 % | 12,114$ | 145,364$ |
| 8 | 52.26 % | 15,142$ | 181,705$ |
| 9 | 65.32 % | 18,928$ | 227,131$ |
| 10 | 81.65 % | 23,660$ | 283,914$ |
1,267,146$ 364%
Total ROI For 10 Years
4,337$
Max Income
347,713$
Cash Price
| Year | Annual Increase | Monthly ROI | Annual ROI |
|---|---|---|---|
| 1 | 14.97 % | 4,337$ | 52,048$ |
| 2 | 18.71 % | 5,422$ | 65,060$ |
| 3 | 23.39 % | 6,777$ | 81,324$ |
| 4 | 29.24 % | 8,471$ | 101,656$ |
| 5 | 36.54 % | 10,589$ | 127,069$ |
| 6 | 45.68 % | 13,236$ | 158,837$ |
| 7 | 57.10 % | 16,546$ | 198,546$ |
| 8 | 71.38 % | 20,682$ | 248,183$ |
| 9 | 89.22 % | 25,852$ | 310,228$ |
| 10 | 111.52 % | 32,315$ | 387,785$ |
1,730,736$ 497%
Total ROI For 10 Years
2,014$
Min Income
347,713$
Cash Price
| Year | Annual Increase | Monthly ROI | Annual ROI |
|---|---|---|---|
| 1 | 6.95 % | 2,014$ | 24,165$ |
| 2 | 8.69 % | 2,517$ | 30,206$ |
| 3 | 10.86 % | 3,146$ | 37,758$ |
| 4 | 13.57 % | 3,933$ | 47,197$ |
| 5 | 16.97 % | 4,916$ | 58,997$ |
| 6 | 21.21 % | 6,145$ | 73,746$ |
| 7 | 26.51 % | 7,682$ | 92,182$ |
| 8 | 33.14 % | 9,602$ | 115,228$ |
| 9 | 41.42 % | 12,003$ | 144,035$ |
| 10 | 51.78 % | 15,004$ | 180,043$ |
803,556$ 231%
Total ROI For 10 Years
District Classification
Rating
A+
Area map
Statistics
Population
349,970
Social Status
Married : 55%
Unmarried : 32%
area
174 Km2
Price Changes Over Last 5 Years
1 Year Change
11.84%
3 Year Change
445.3%
5 Year Change
490%
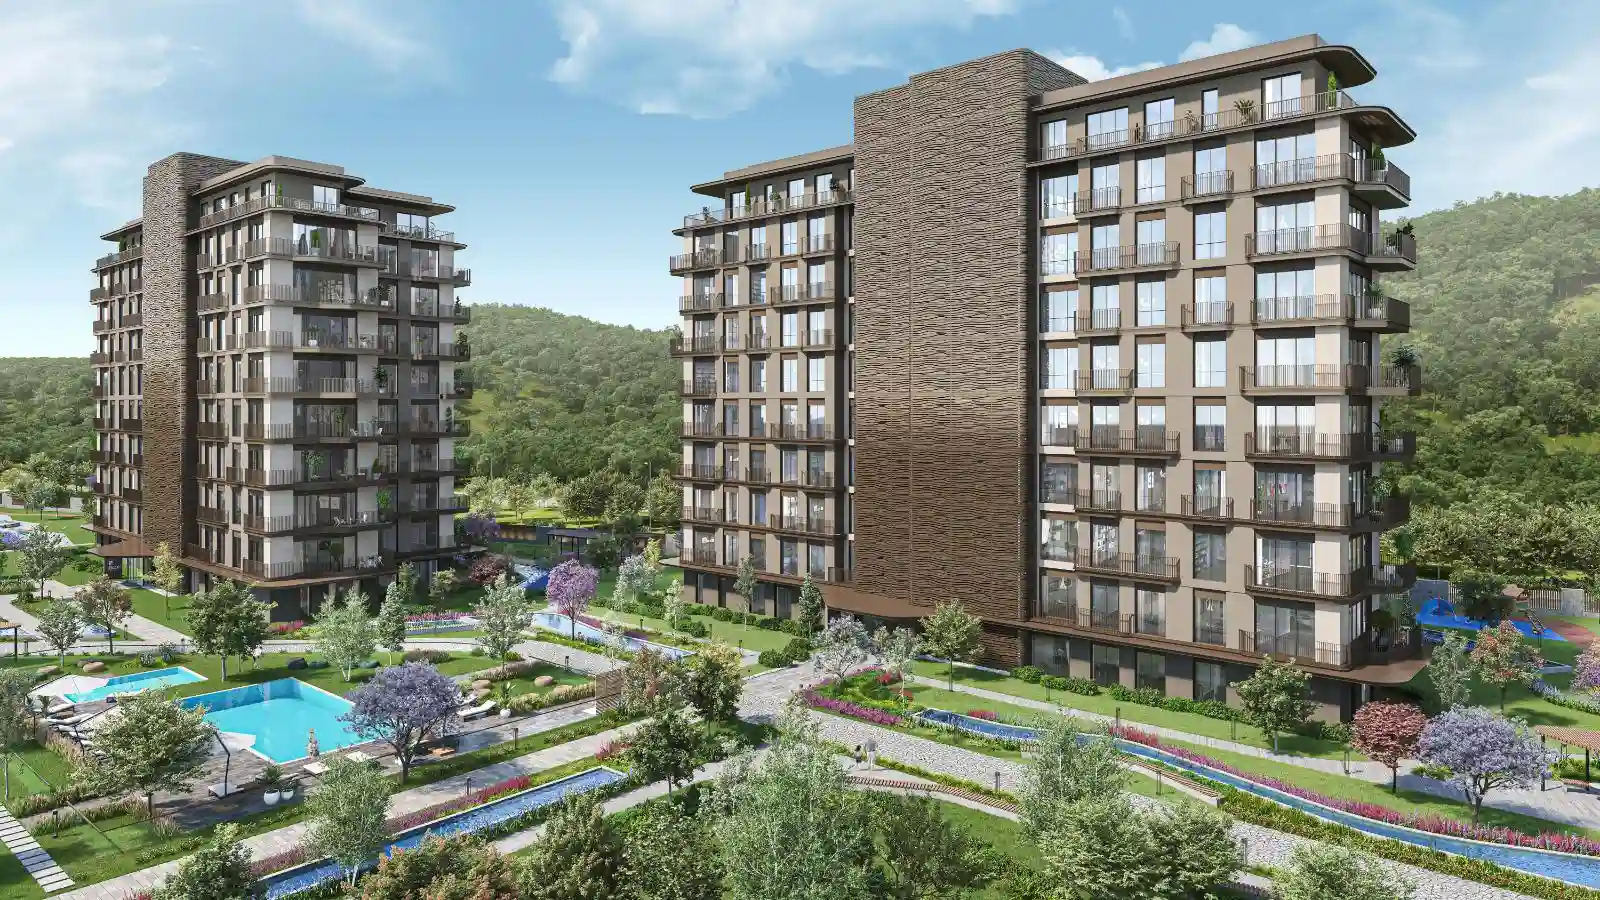
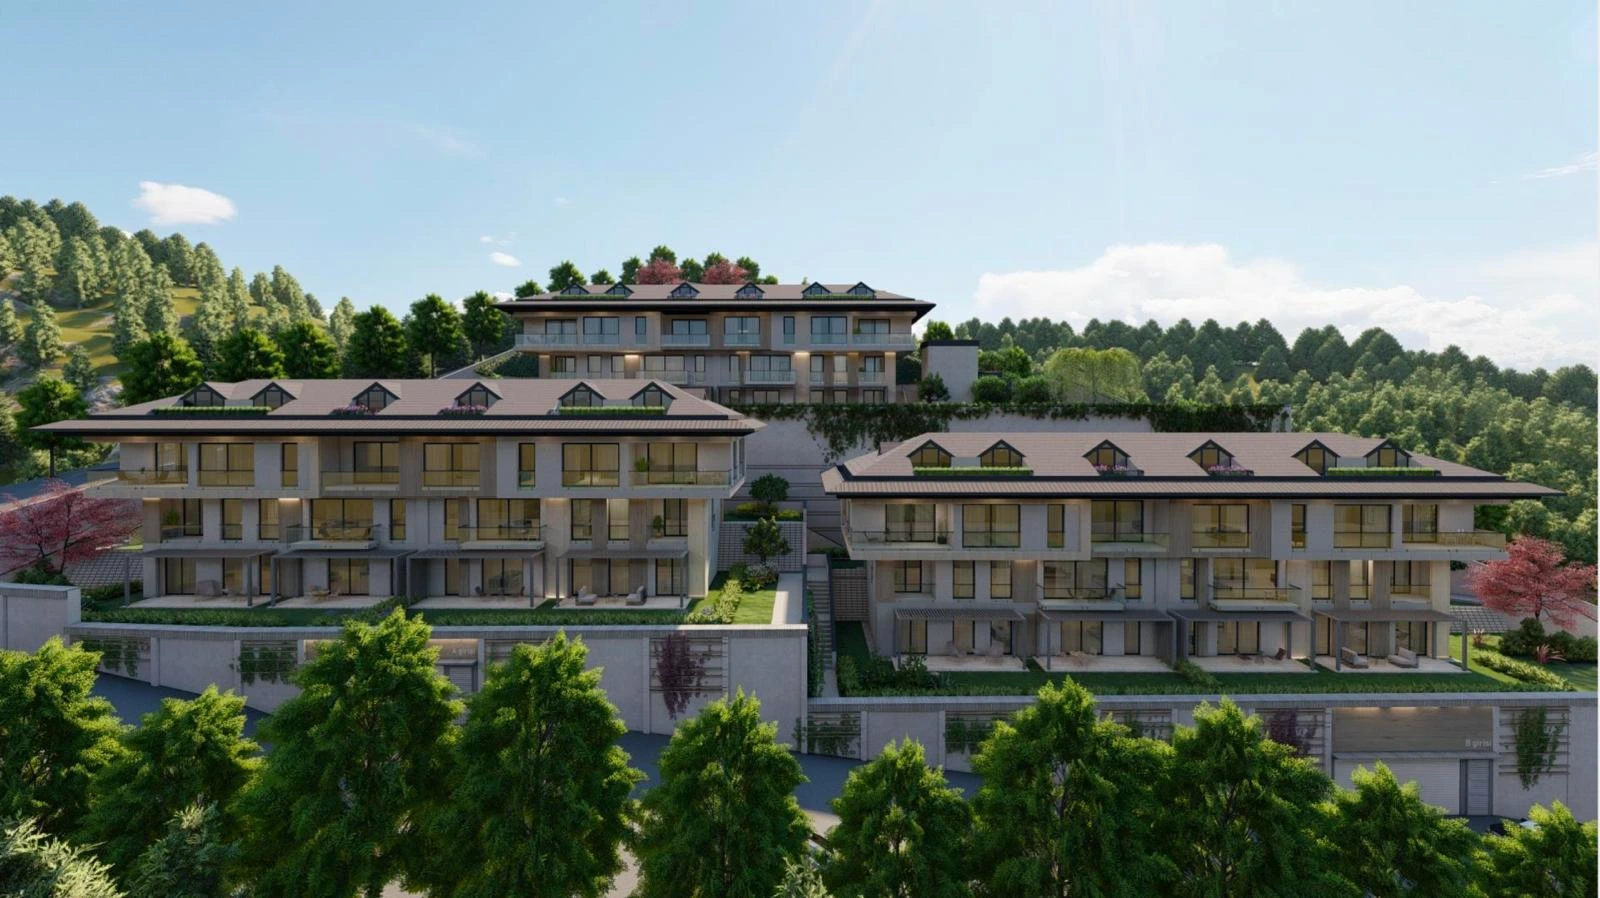
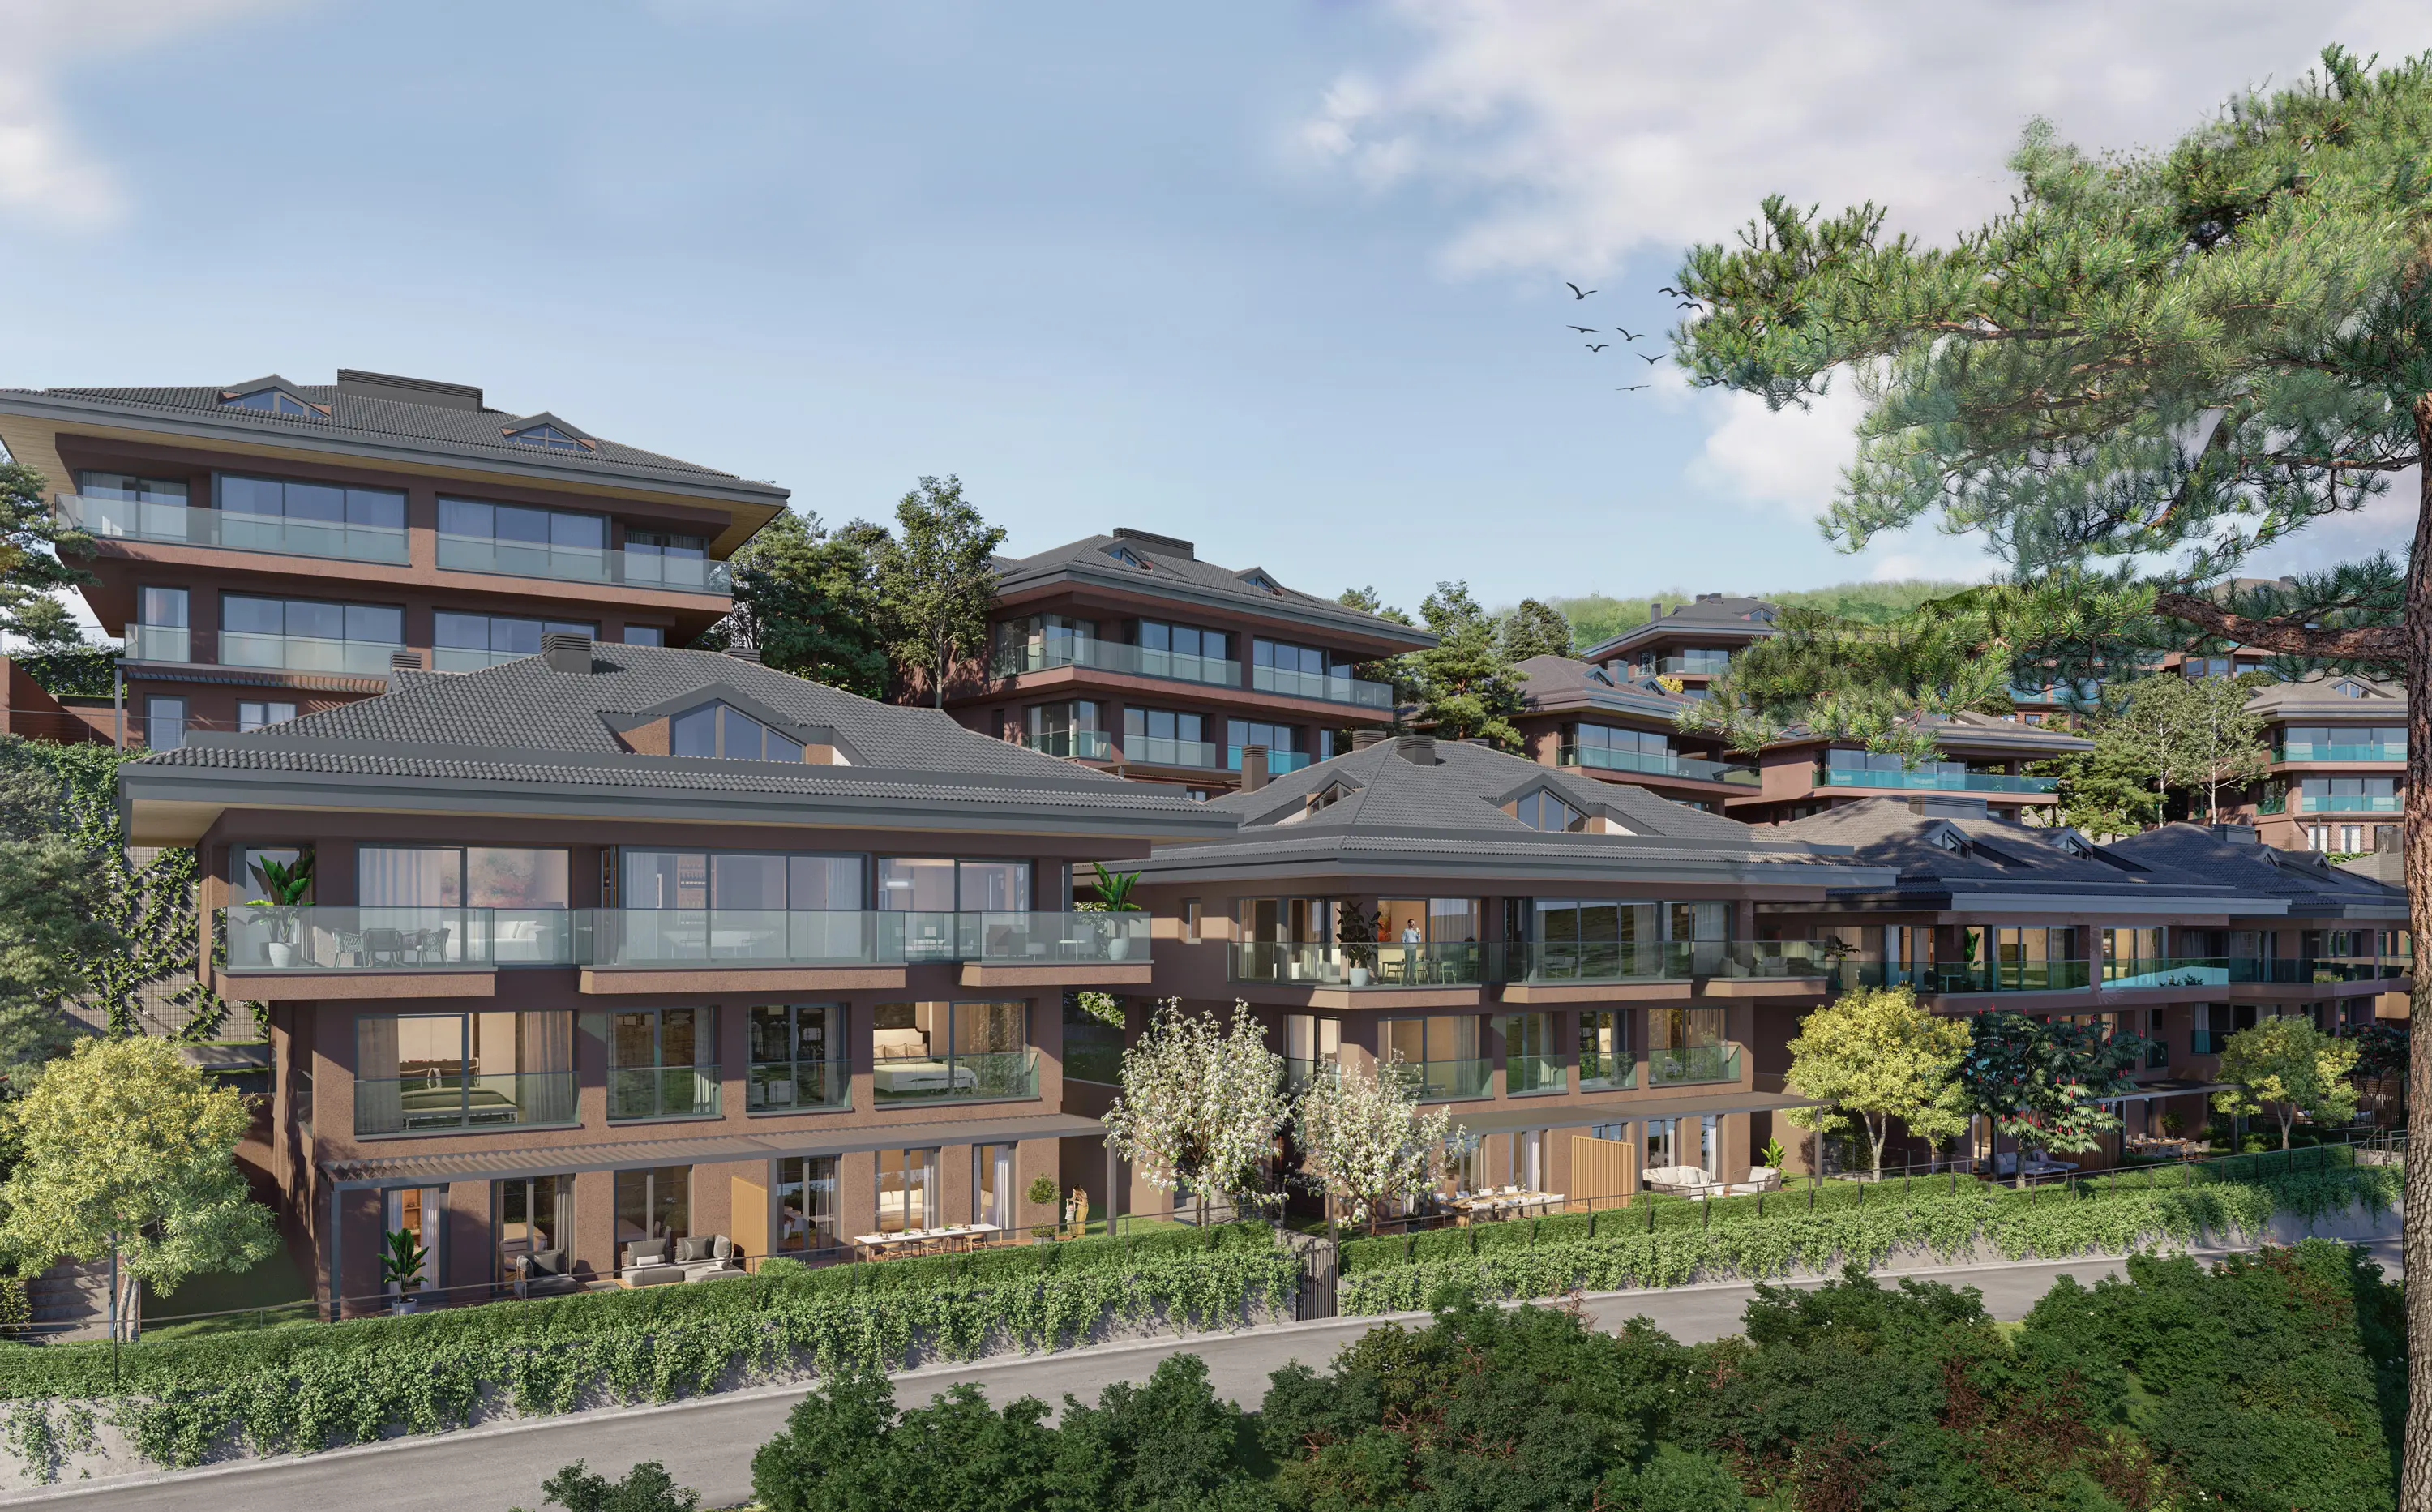
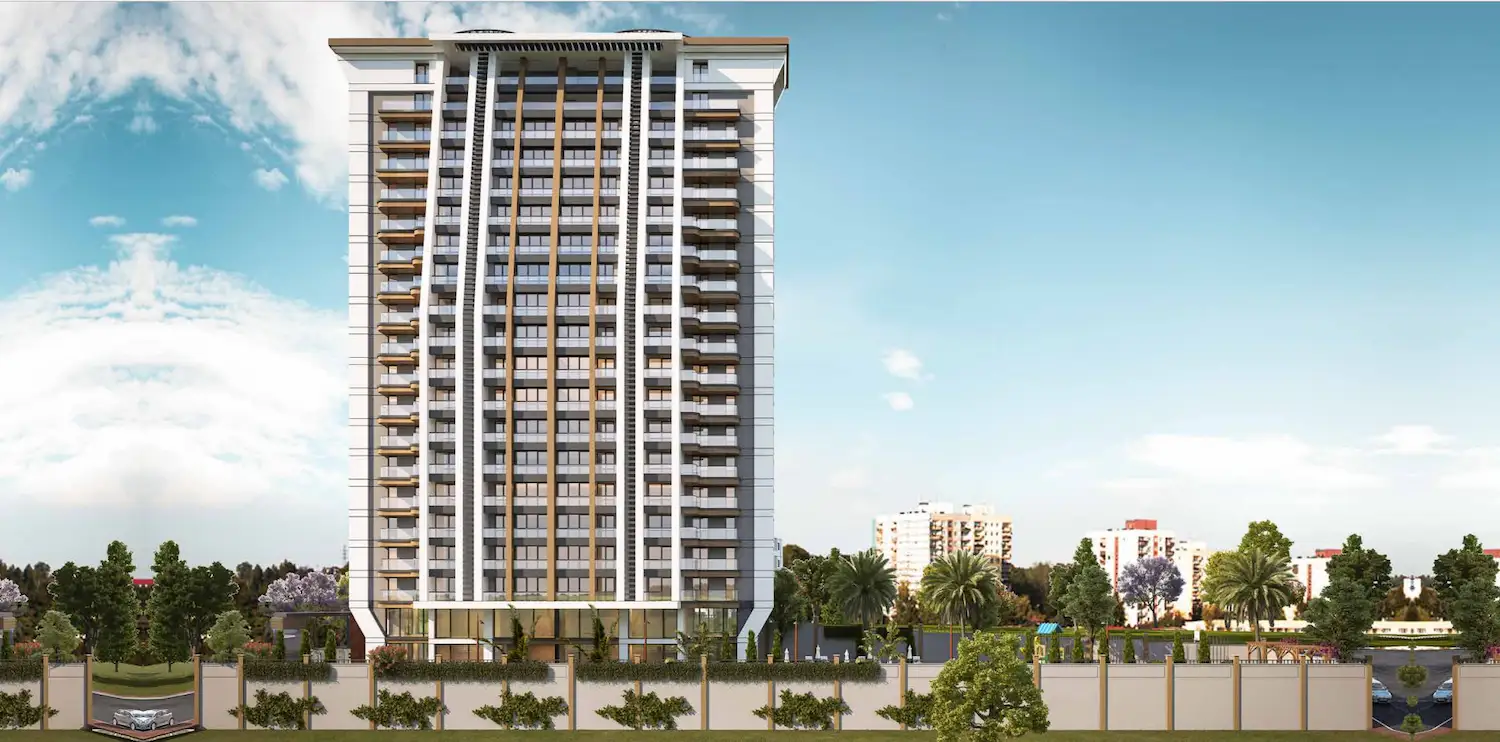
Projects Have same ROI in This Area


.webp)
Have Question Or Suggestion ?
Please Share Your Thought, To Make It Real


