Return on Investment In Turkey
We are providing a financial metric for real estate investors as it helps them to determine the profitability of their real estate investment in Turkey
571$
Average Income
463$ - 679$
Min Income - Max Income
475,000$
Cash Price
| Year | Annual Increase | Monthly ROI | Annual ROI |
|---|---|---|---|
| 1 | 1.44 % | 571$ | 6,856$ |
| 2 | 1.80 % | 714$ | 8,570$ |
| 3 | 2.26 % | 893$ | 10,713$ |
| 4 | 2.82 % | 1,116$ | 13,391$ |
| 5 | 3.52 % | 1,395$ | 16,738$ |
| 6 | 4.40 % | 1,744$ | 20,923$ |
| 7 | 5.51 % | 2,179$ | 26,154$ |
| 8 | 6.88 % | 2,724$ | 32,692$ |
| 9 | 8.60 % | 3,405$ | 40,865$ |
| 10 | 10.75 % | 4,257$ | 51,081$ |
227,983$ 47%
Total ROI For 10 Years
679$
Max Income
475,000$
Cash Price
| Year | Annual Increase | Monthly ROI | Annual ROI |
|---|---|---|---|
| 1 | 1.72 % | 679$ | 8,153$ |
| 2 | 2.15 % | 849$ | 10,191$ |
| 3 | 2.68 % | 1,062$ | 12,739$ |
| 4 | 3.35 % | 1,327$ | 15,924$ |
| 5 | 4.19 % | 1,659$ | 19,905$ |
| 6 | 5.24 % | 2,073$ | 24,881$ |
| 7 | 6.55 % | 2,592$ | 31,102$ |
| 8 | 8.18 % | 3,240$ | 38,877$ |
| 9 | 10.23 % | 4,050$ | 48,596$ |
| 10 | 12.79 % | 5,062$ | 60,746$ |
271,115$ 57%
Total ROI For 10 Years
463$
Min Income
475,000$
Cash Price
| Year | Annual Increase | Monthly ROI | Annual ROI |
|---|---|---|---|
| 1 | 1.17 % | 463$ | 5,559$ |
| 2 | 1.46 % | 579$ | 6,949$ |
| 3 | 1.83 % | 724$ | 8,686$ |
| 4 | 2.29 % | 905$ | 10,857$ |
| 5 | 2.86 % | 1,131$ | 13,572$ |
| 6 | 3.57 % | 1,414$ | 16,965$ |
| 7 | 4.46 % | 1,767$ | 21,206$ |
| 8 | 5.58 % | 2,209$ | 26,507$ |
| 9 | 6.98 % | 2,761$ | 33,134$ |
| 10 | 8.72 % | 3,451$ | 41,417$ |
184,851$ 38%
Total ROI For 10 Years
District Classification
Rating
a
Area map
Statistics
Population
287,000
Social Status
Married : 56%
Unmarried : 34%
area
11 Km2
Price Changes Over Last 5 Years
1 Year Change
5.61%
3 Year Change
236.8%
5 Year Change
279%
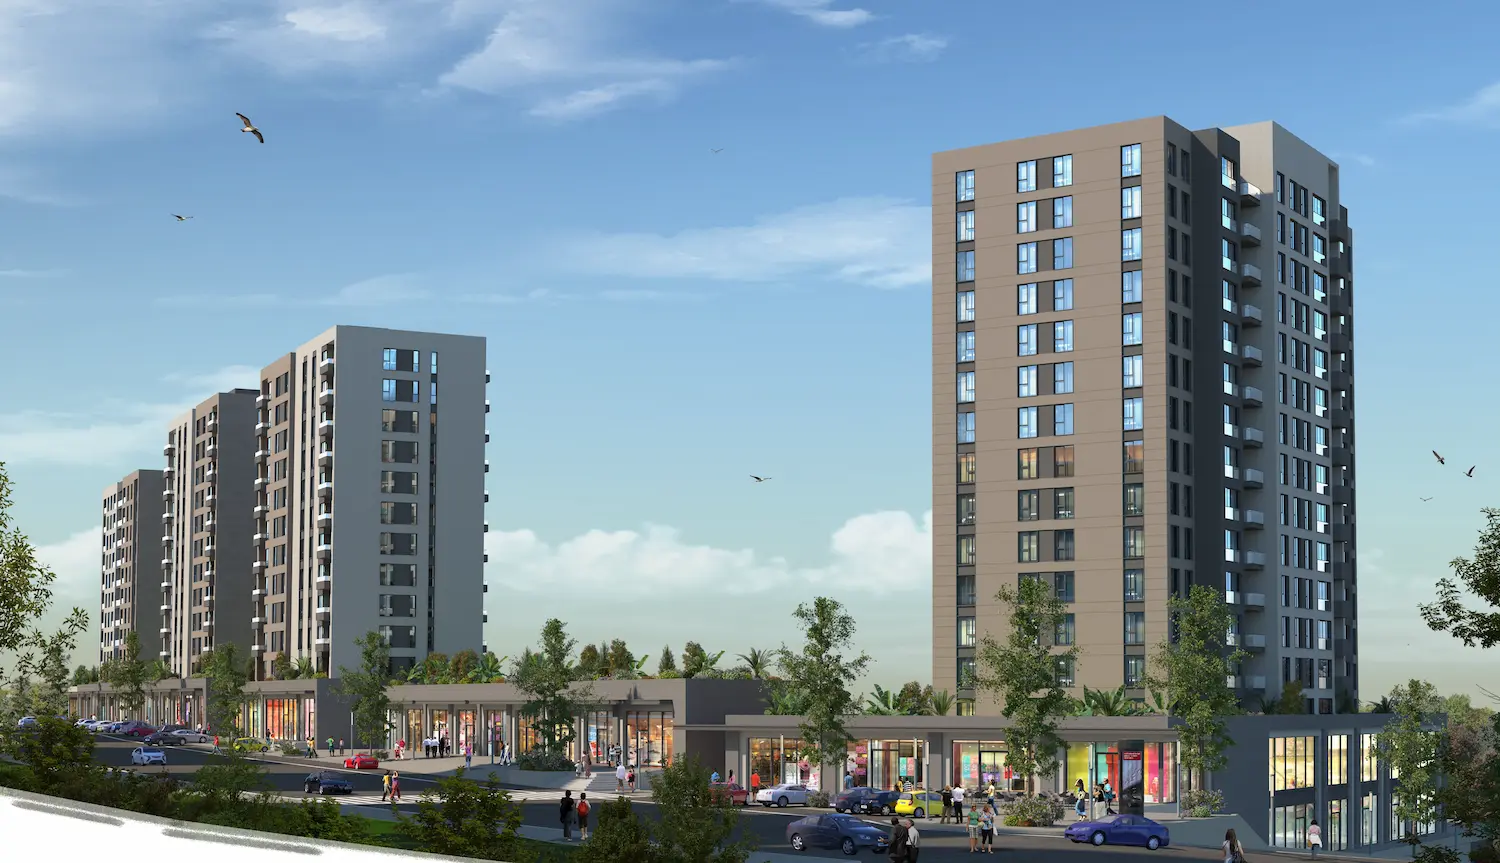
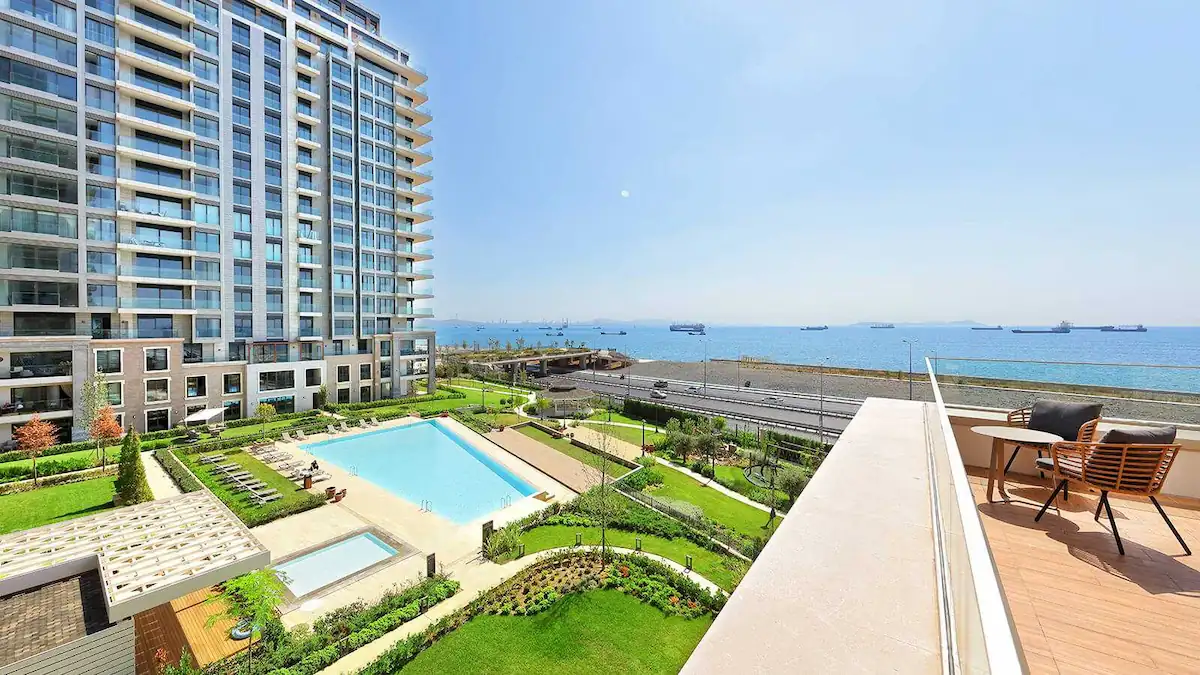
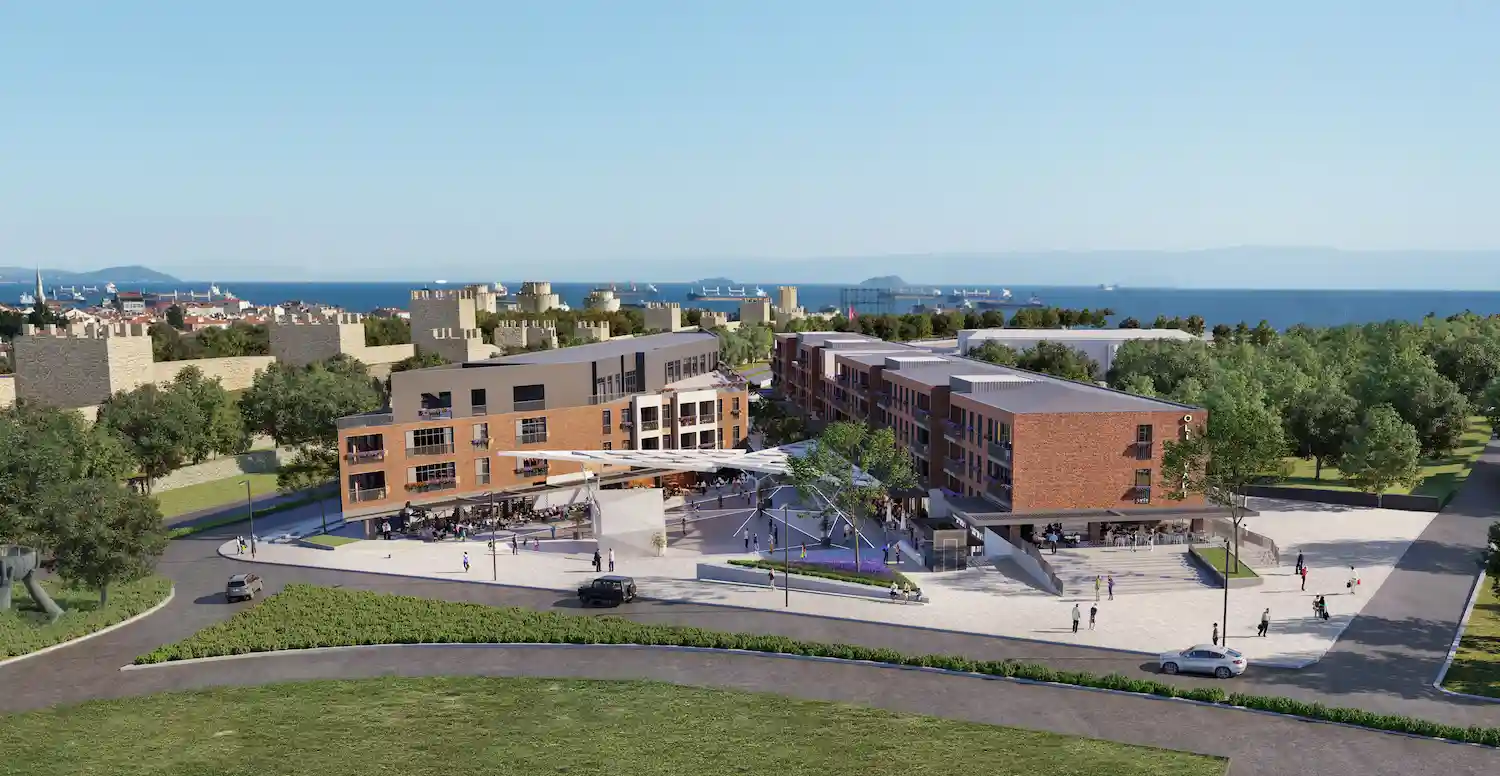
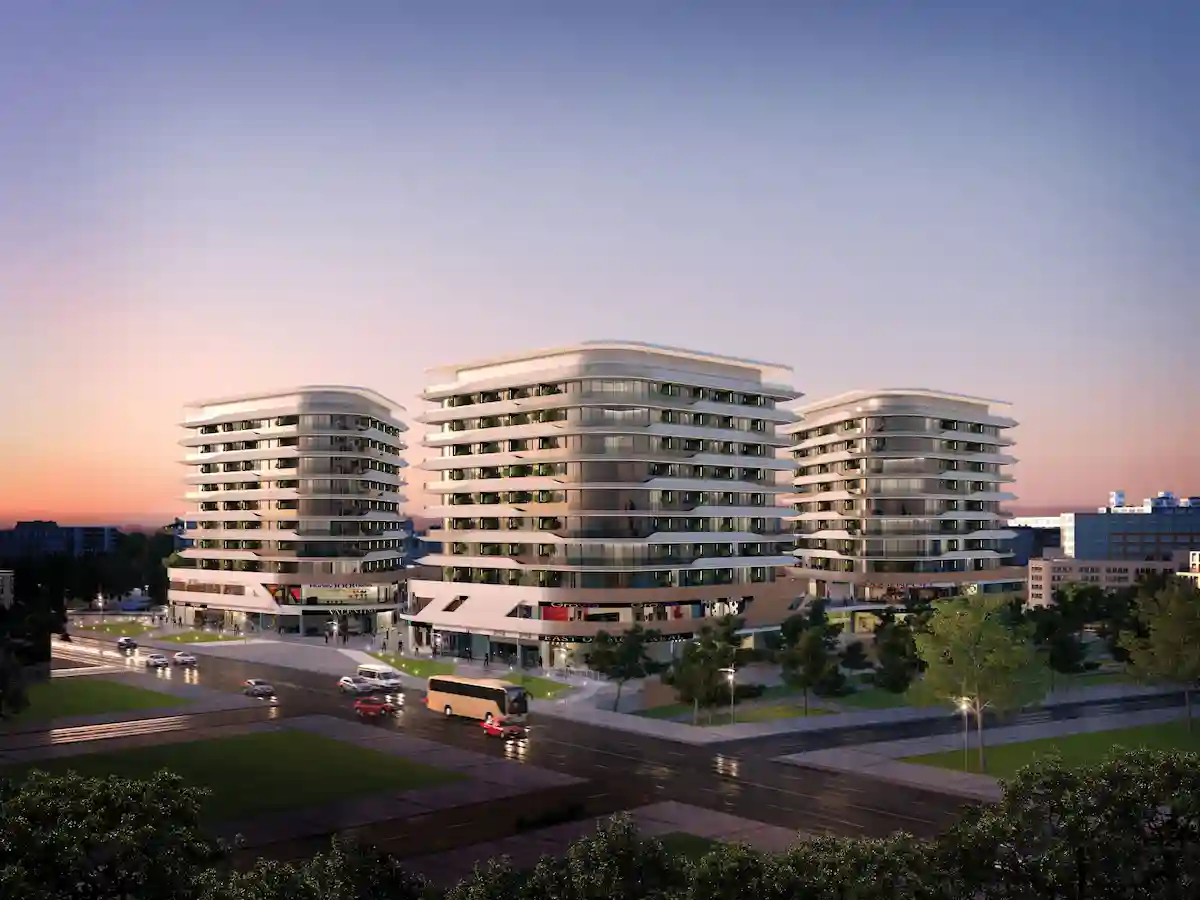
Projects Have same ROI in This Area
 (1).webp)


.webp)
Have Question Or Suggestion ?
Please Share Your Thought, To Make It Real


