Return on Investment In Turkey
We are providing a financial metric for real estate investors as it helps them to determine the profitability of their real estate investment in Turkey
618$
Average Income
463$ - 772$
Min Income - Max Income
10,151$
Cash Price
| Year | Annual Increase | Monthly ROI | Annual ROI |
|---|---|---|---|
| 1 | 73.05 % | 618$ | 7,415$ |
| 2 | 91.31 % | 772$ | 9,268$ |
| 3 | 114.13 % | 965$ | 11,585$ |
| 4 | 142.67 % | 1,207$ | 14,481$ |
| 5 | 178.33 % | 1,508$ | 18,102$ |
| 6 | 222.92 % | 1,886$ | 22,627$ |
| 7 | 278.65 % | 2,357$ | 28,284$ |
| 8 | 348.31 % | 2,946$ | 35,355$ |
| 9 | 435.39 % | 3,683$ | 44,194$ |
| 10 | 544.23 % | 4,604$ | 55,242$ |
246,554$ 2,428%
Total ROI For 10 Years
772$
Max Income
10,151$
Cash Price
| Year | Annual Increase | Monthly ROI | Annual ROI |
|---|---|---|---|
| 1 | 91.31 % | 772$ | 9,268$ |
| 2 | 114.13 % | 965$ | 11,585$ |
| 3 | 142.67 % | 1,207$ | 14,481$ |
| 4 | 178.33 % | 1,508$ | 18,102$ |
| 5 | 222.92 % | 1,886$ | 22,627$ |
| 6 | 278.65 % | 2,357$ | 28,284$ |
| 7 | 348.31 % | 2,946$ | 35,355$ |
| 8 | 435.39 % | 3,683$ | 44,194$ |
| 9 | 544.23 % | 4,604$ | 55,242$ |
| 10 | 680.29 % | 5,754$ | 69,053$ |
308,192$ 3,036%
Total ROI For 10 Years
463$
Min Income
10,151$
Cash Price
| Year | Annual Increase | Monthly ROI | Annual ROI |
|---|---|---|---|
| 1 | 54.78 % | 463$ | 5,561$ |
| 2 | 68.48 % | 579$ | 6,951$ |
| 3 | 85.60 % | 724$ | 8,689$ |
| 4 | 107.00 % | 905$ | 10,861$ |
| 5 | 133.75 % | 1,131$ | 13,576$ |
| 6 | 167.19 % | 1,414$ | 16,970$ |
| 7 | 208.99 % | 1,768$ | 21,213$ |
| 8 | 261.23 % | 2,210$ | 26,516$ |
| 9 | 326.54 % | 2,762$ | 33,145$ |
| 10 | 408.17 % | 3,453$ | 41,432$ |
184,915$ 1,821%
Total ROI For 10 Years
District Classification
Rating
a
Area map
Statistics
Population
448,882
Social Status
Married : 56%
Unmarried : 46%
area
52 Km2
Price Changes Over Last 5 Years
1 Year Change
13.64%
3 Year Change
339%
5 Year Change
370.8%
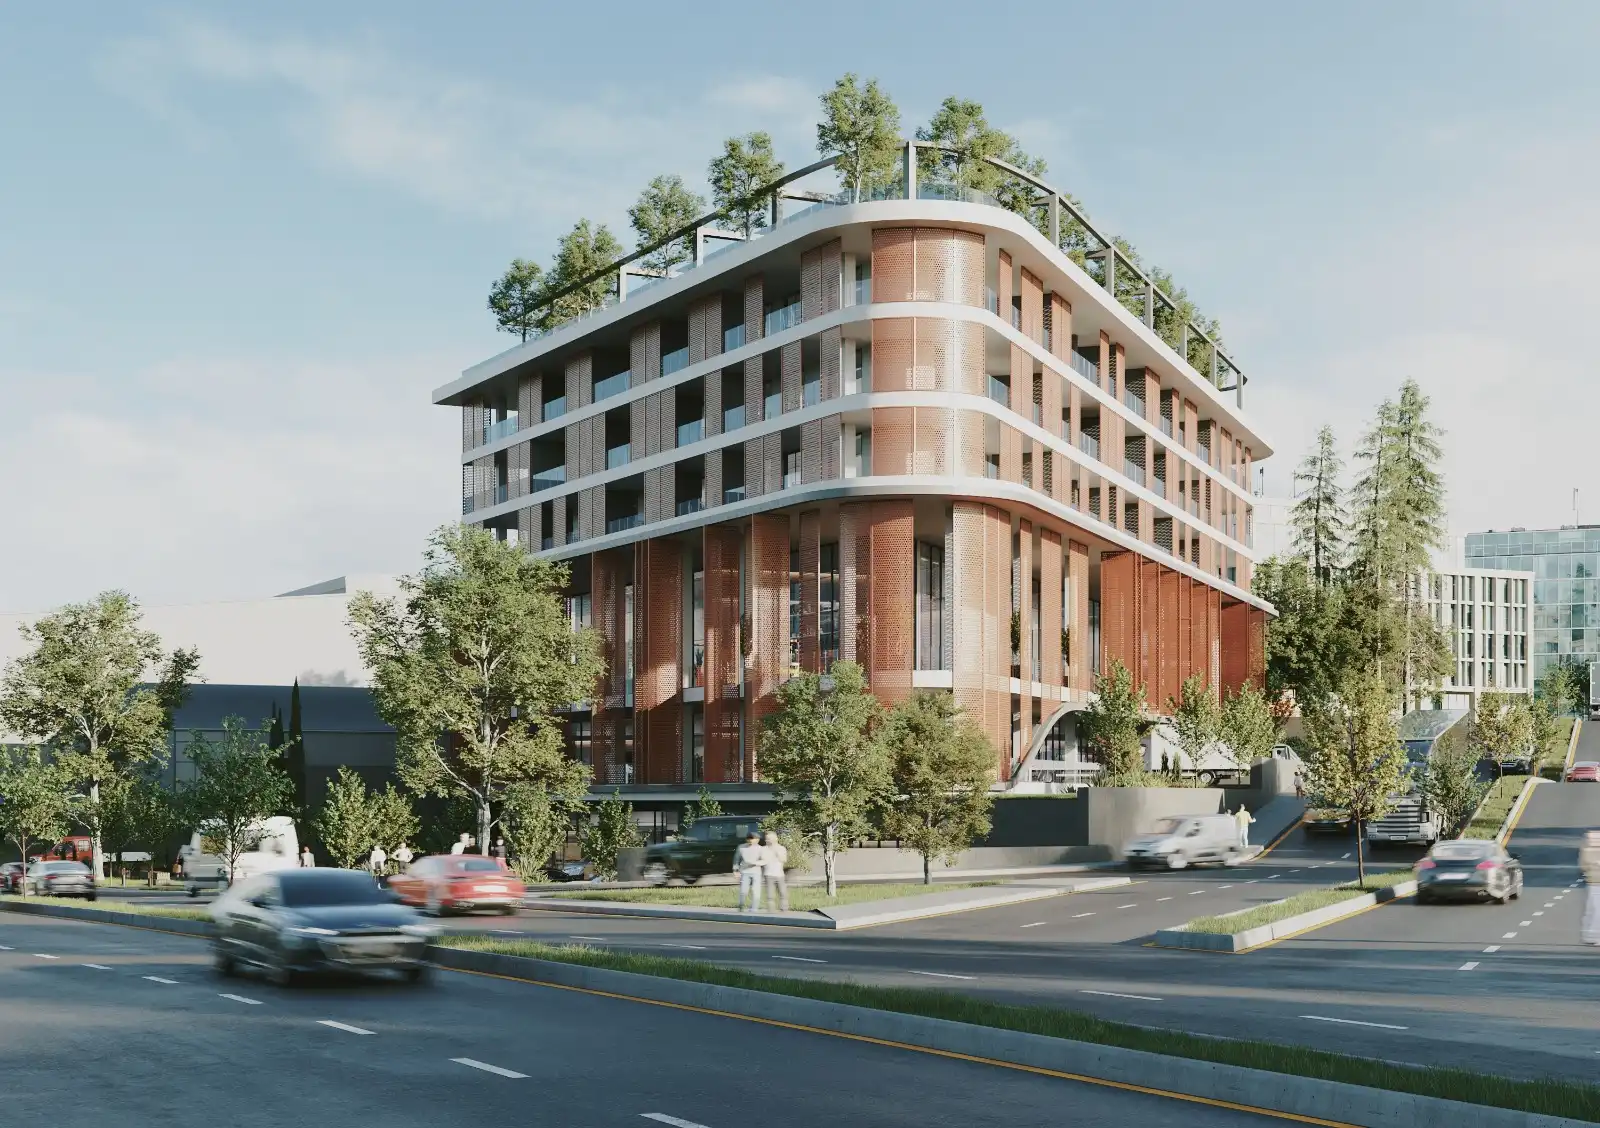
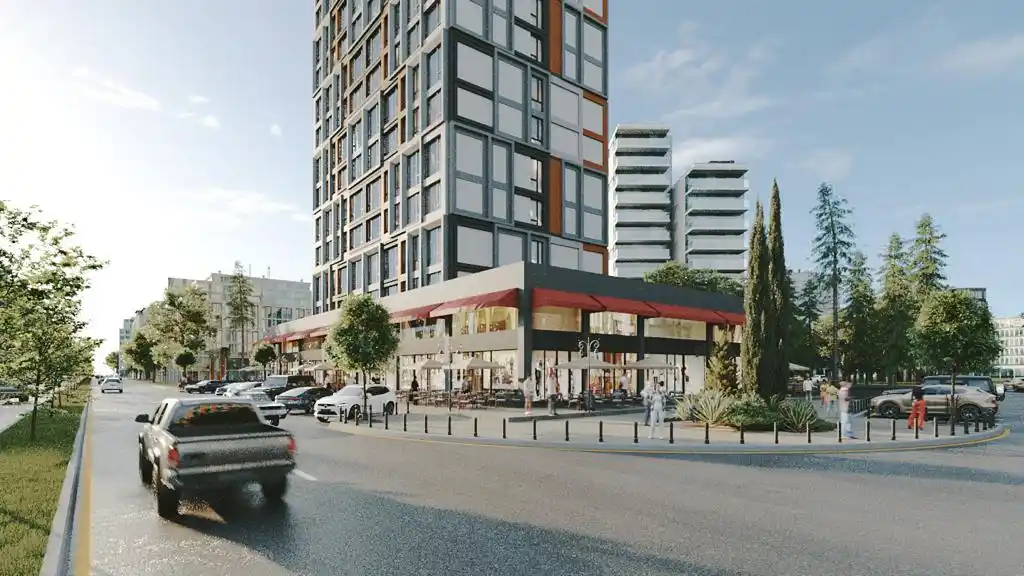
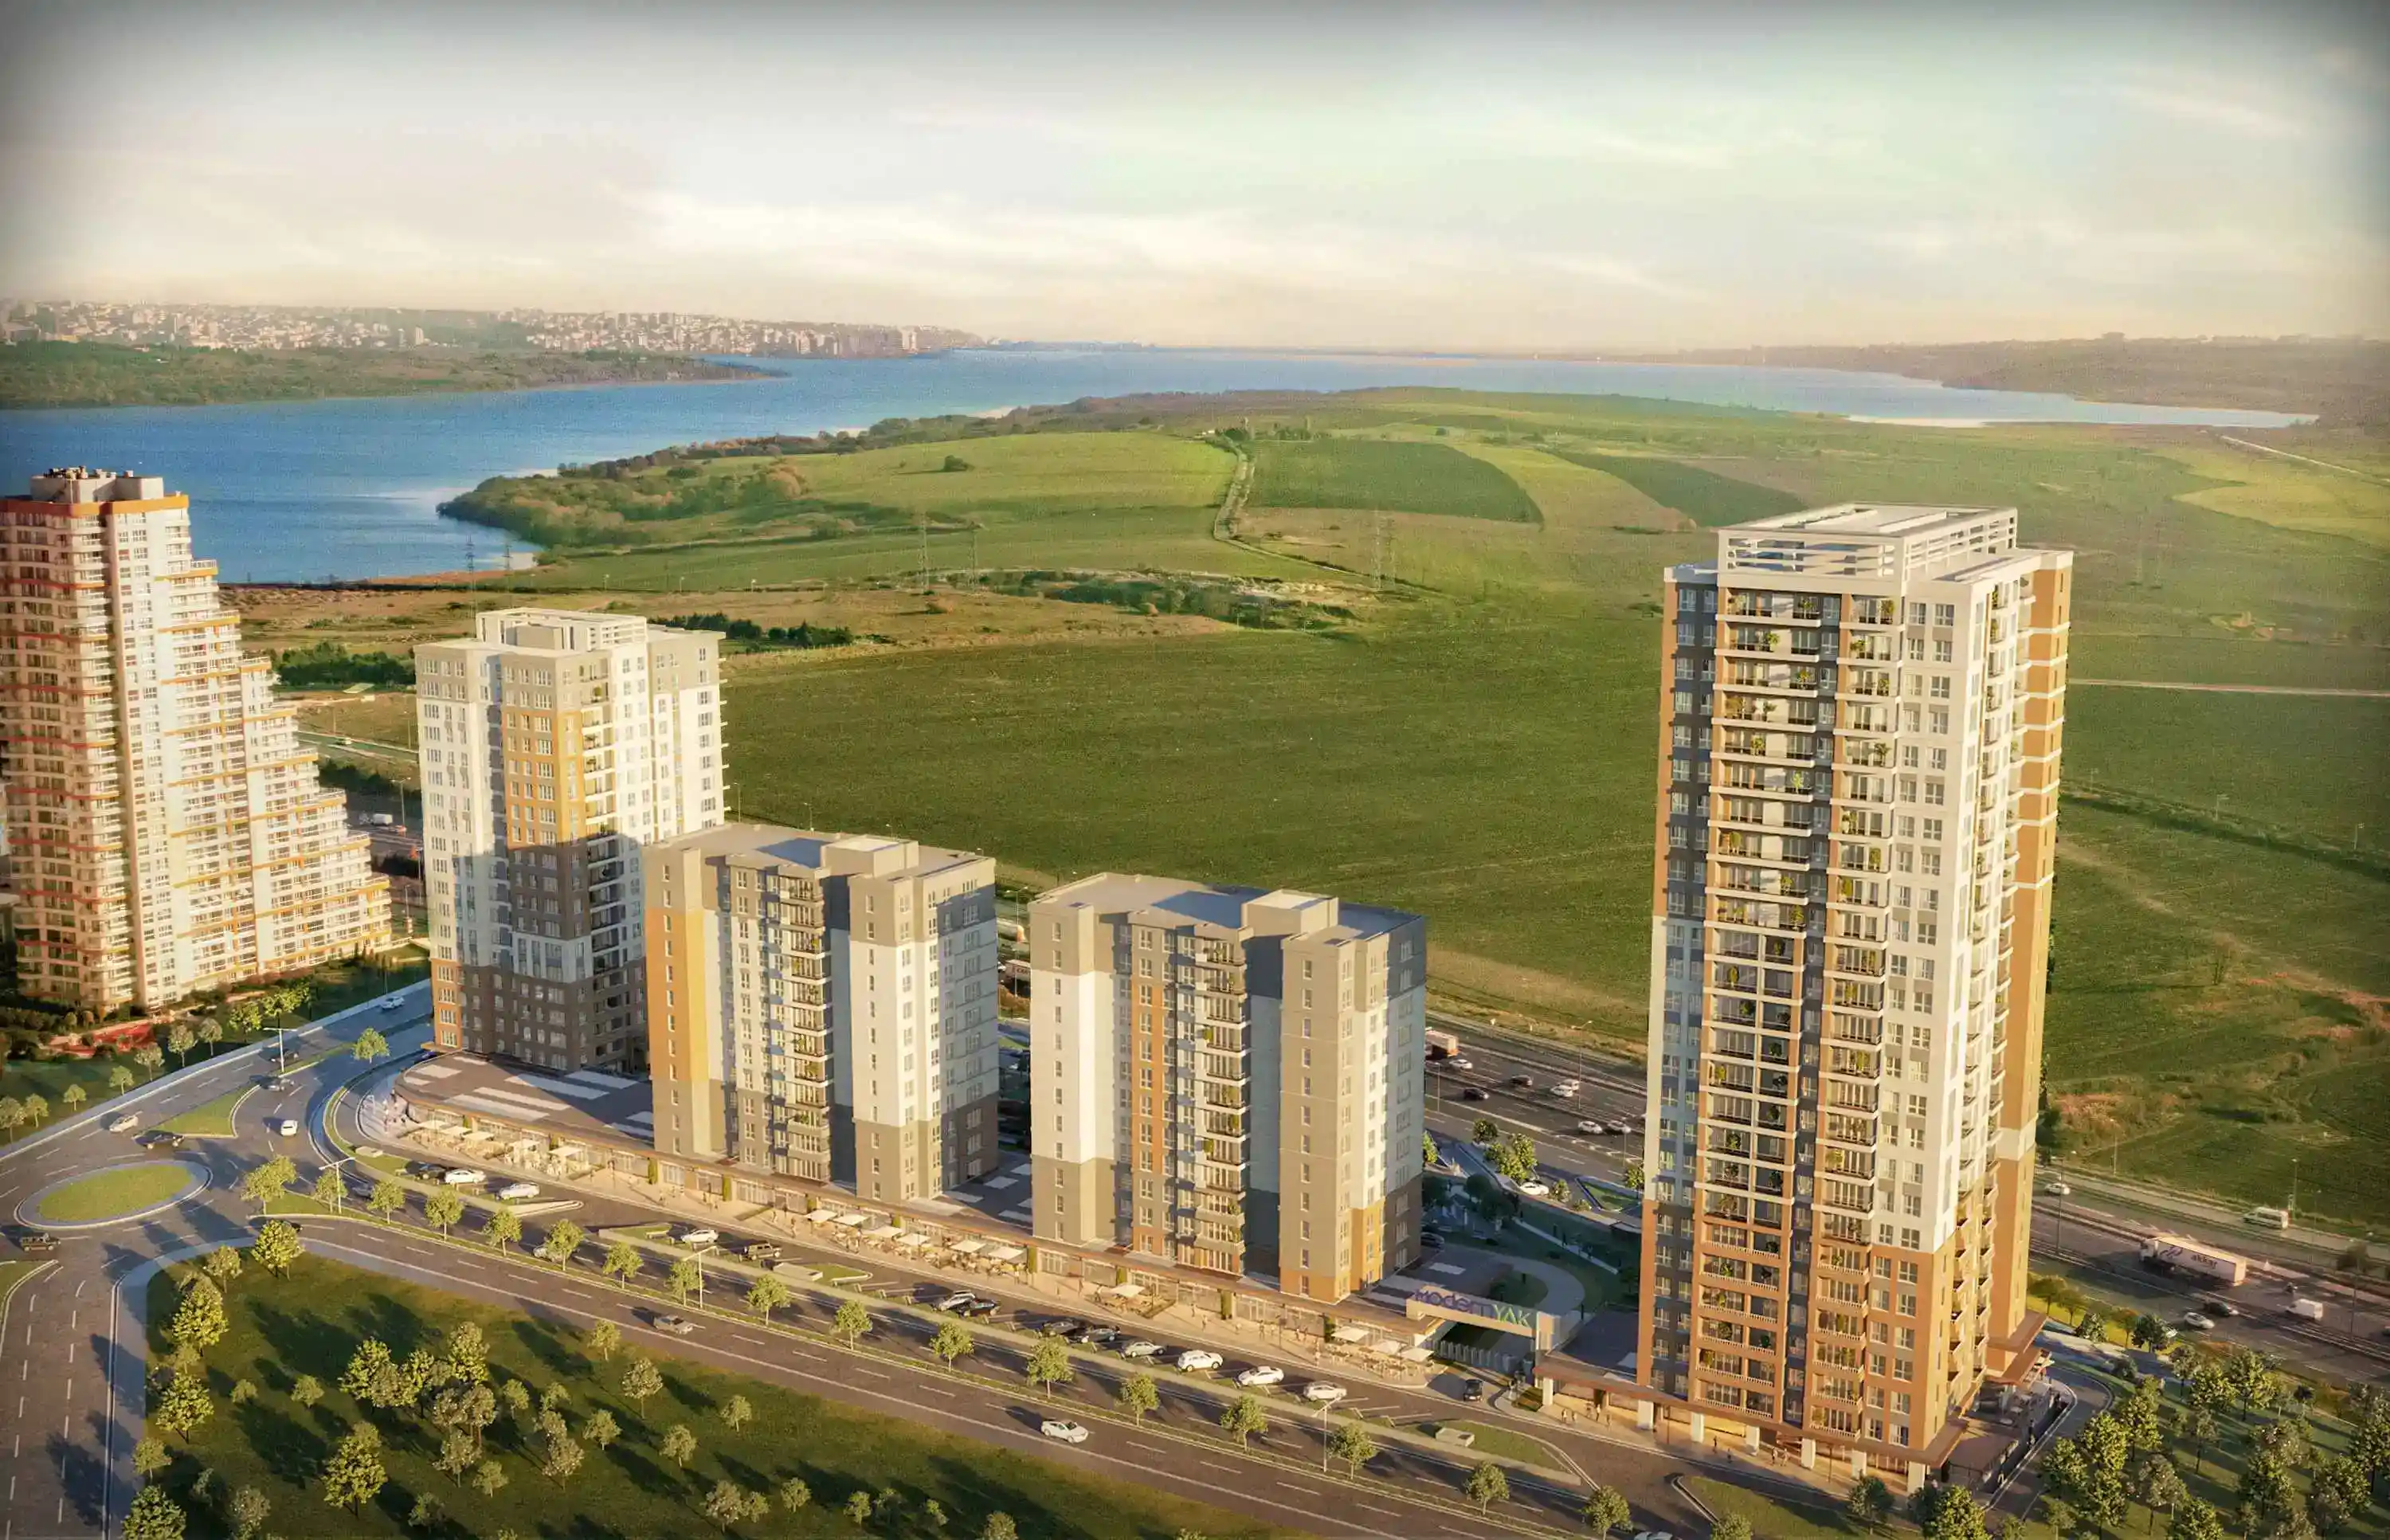
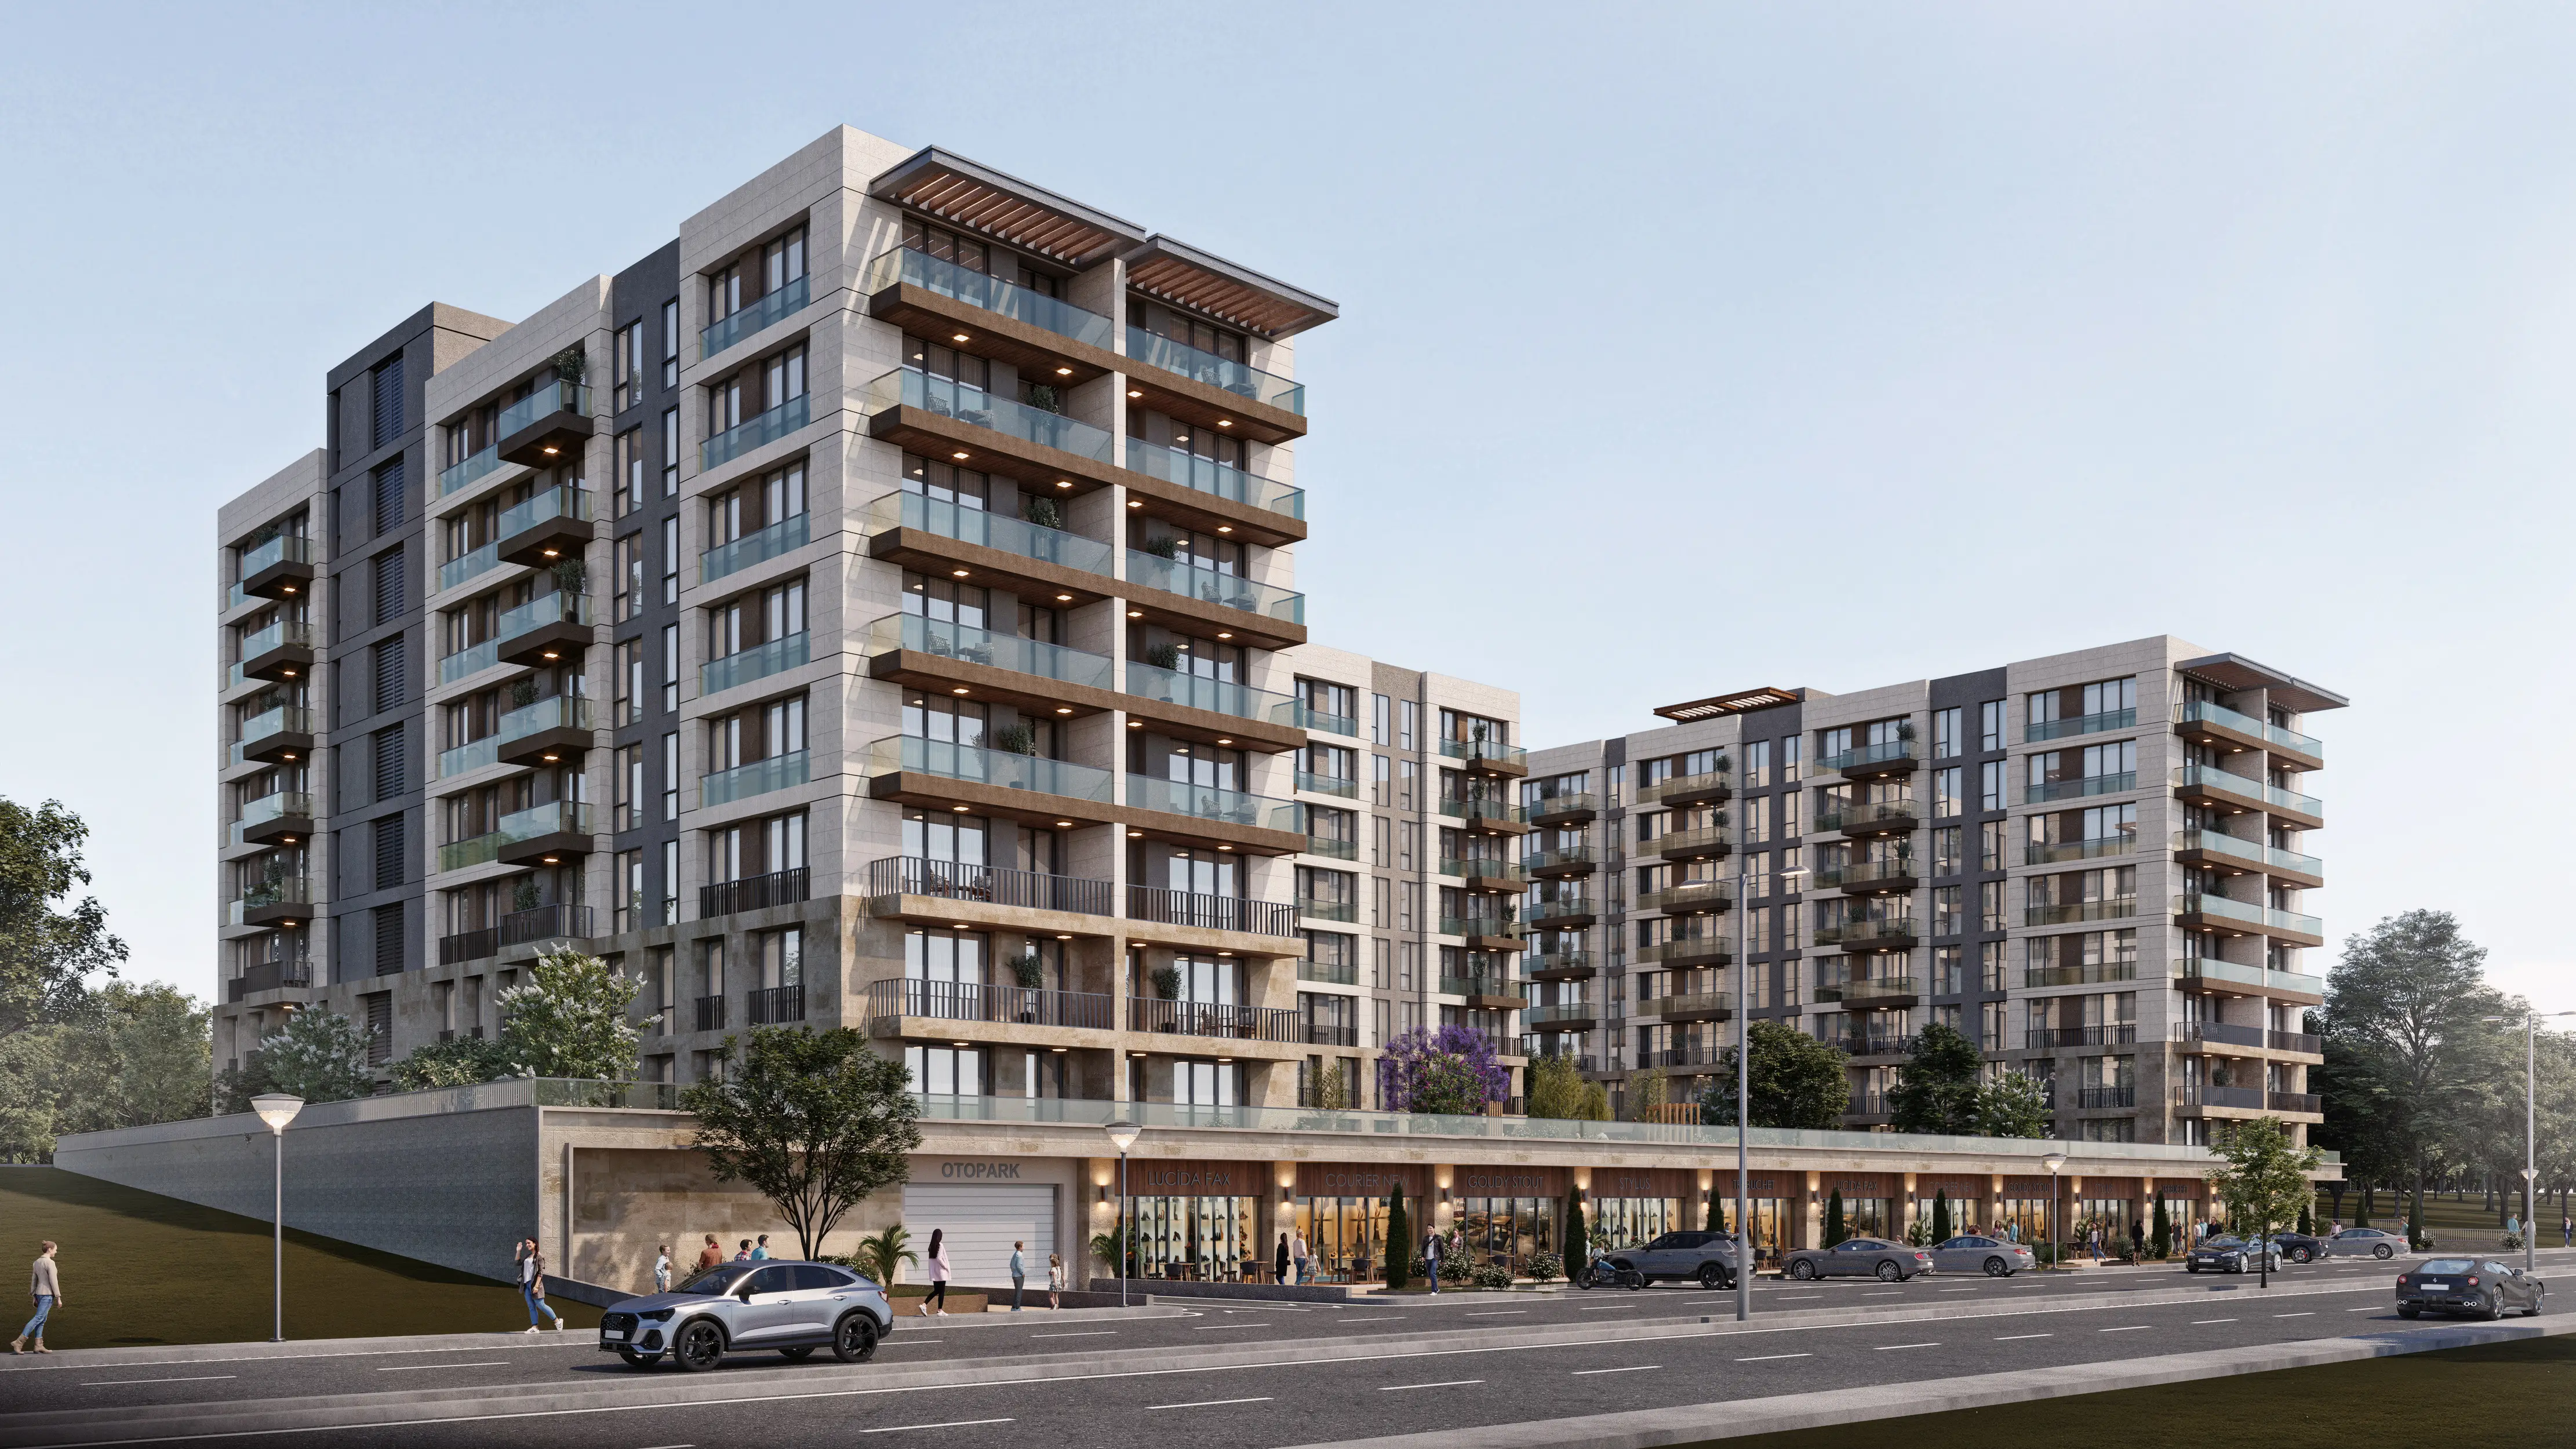
Projects Have same ROI in This Area
.webp)
Have Question Or Suggestion ?
Please Share Your Thought, To Make It Real


