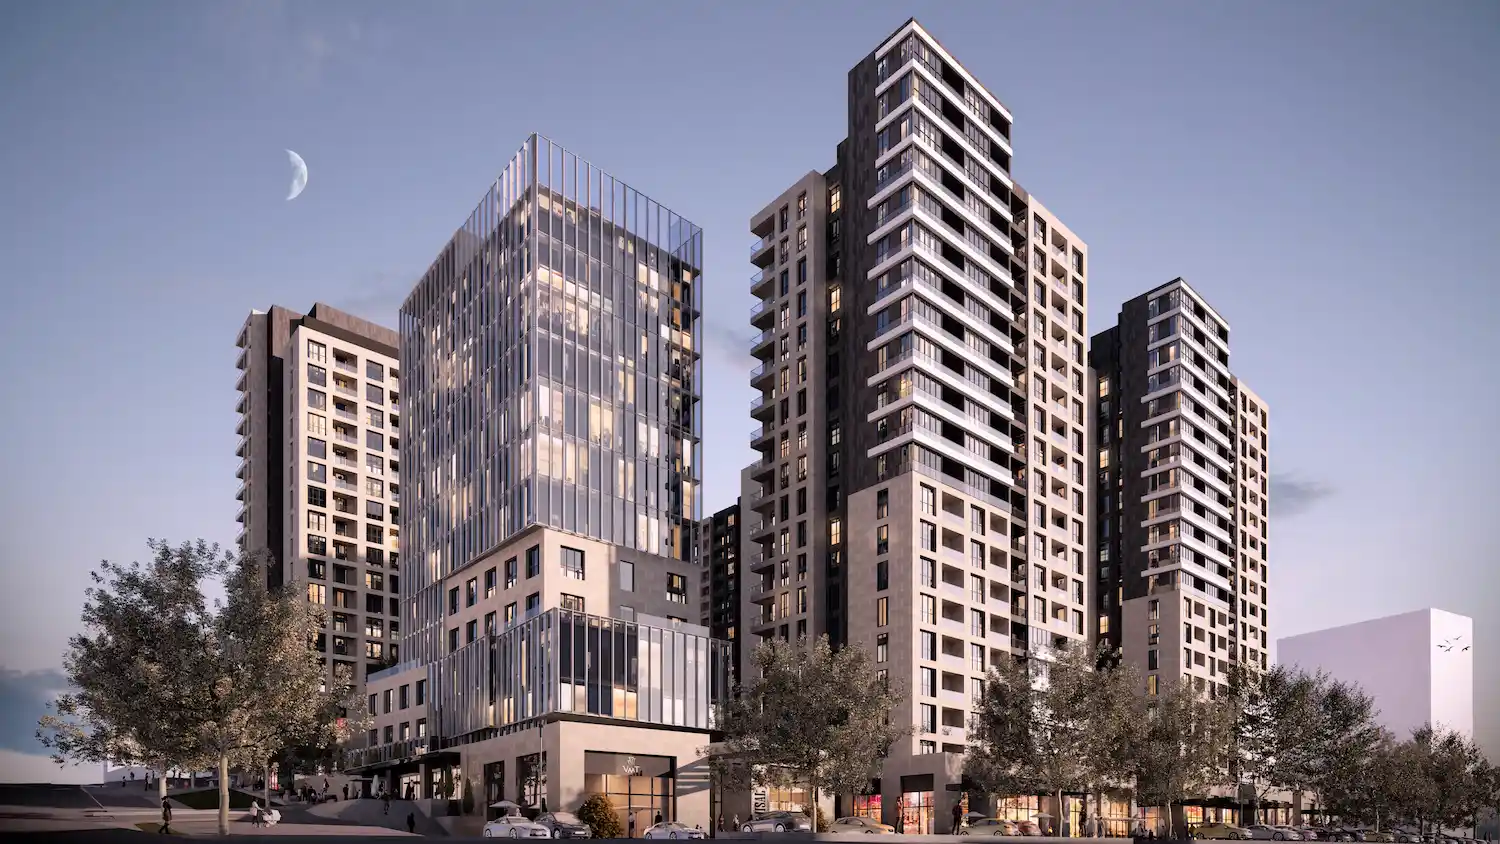
Return on Investment In Turkey
We are providing a financial metric for real estate investors as it helps them to determine the profitability of their real estate investment in Turkey
651$
Average Income
465$ - 836$
Min Income - Max Income
95,891$
Cash Price
| Year | Annual Increase | Monthly ROI | Annual ROI |
|---|---|---|---|
| 1 | 8.14 % | 651$ | 7,807$ |
| 2 | 10.18 % | 813$ | 9,759$ |
| 3 | 12.72 % | 1,017$ | 12,199$ |
| 4 | 15.90 % | 1,271$ | 15,248$ |
| 5 | 19.88 % | 1,588$ | 19,060$ |
| 6 | 24.85 % | 1,985$ | 23,826$ |
| 7 | 31.06 % | 2,482$ | 29,782$ |
| 8 | 38.82 % | 3,102$ | 37,227$ |
| 9 | 48.53 % | 3,878$ | 46,534$ |
| 10 | 60.66 % | 4,847$ | 58,168$ |
259,610$ 270%
Total ROI For 10 Years
836$
Max Income
95,891$
Cash Price
| Year | Annual Increase | Monthly ROI | Annual ROI |
|---|---|---|---|
| 1 | 10.47 % | 836$ | 10,038$ |
| 2 | 13.08 % | 1,046$ | 12,547$ |
| 3 | 16.36 % | 1,307$ | 15,684$ |
| 4 | 20.45 % | 1,634$ | 19,605$ |
| 5 | 25.56 % | 2,042$ | 24,506$ |
| 6 | 31.95 % | 2,553$ | 30,633$ |
| 7 | 39.93 % | 3,191$ | 38,291$ |
| 8 | 49.91 % | 3,989$ | 47,864$ |
| 9 | 62.39 % | 4,986$ | 59,830$ |
| 10 | 77.99 % | 6,232$ | 74,787$ |
333,785$ 348%
Total ROI For 10 Years
465$
Min Income
95,891$
Cash Price
| Year | Annual Increase | Monthly ROI | Annual ROI |
|---|---|---|---|
| 1 | 5.82 % | 465$ | 5,577$ |
| 2 | 7.27 % | 581$ | 6,971$ |
| 3 | 9.09 % | 726$ | 8,713$ |
| 4 | 11.36 % | 908$ | 10,892$ |
| 5 | 14.20 % | 1,135$ | 13,615$ |
| 6 | 17.75 % | 1,418$ | 17,018$ |
| 7 | 22.18 % | 1,773$ | 21,273$ |
| 8 | 27.73 % | 2,216$ | 26,591$ |
| 9 | 34.66 % | 2,770$ | 33,239$ |
| 10 | 43.33 % | 3,462$ | 41,548$ |
185,436$ 193%
Total ROI For 10 Years
District Classification
Rating
A-
Area map
Statistics
Population
745,125
Social Status
Married : 62%
Unmarried : 30%
area
22 Km2
Price Changes Over Last 5 Years
1 Year Change
13.59%
3 Year Change
263.6%
5 Year Change
273.2%
Projects Have same ROI in This Area
Have Question Or Suggestion ?
Please Share Your Thought, To Make It Real



.webp)
.webp)
