Return on Investment In Turkey
We are providing a financial metric for real estate investors as it helps them to determine the profitability of their real estate investment in Turkey
837$
Average Income
527$ - 1,147$
Min Income - Max Income
204,975$
Cash Price
| Year | Annual Increase | Monthly ROI | Annual ROI |
|---|---|---|---|
| 1 | 4.90 % | 837$ | 10,041$ |
| 2 | 6.12 % | 1,046$ | 12,552$ |
| 3 | 7.65 % | 1,307$ | 15,689$ |
| 4 | 9.57 % | 1,634$ | 19,612$ |
| 5 | 11.96 % | 2,043$ | 24,515$ |
| 6 | 14.95 % | 2,554$ | 30,643$ |
| 7 | 18.69 % | 3,192$ | 38,304$ |
| 8 | 23.36 % | 3,990$ | 47,880$ |
| 9 | 29.20 % | 4,988$ | 59,850$ |
| 10 | 36.50 % | 6,234$ | 74,813$ |
333,899$ 162%
Total ROI For 10 Years
1,147$
Max Income
204,975$
Cash Price
| Year | Annual Increase | Monthly ROI | Annual ROI |
|---|---|---|---|
| 1 | 6.71 % | 1,147$ | 13,760$ |
| 2 | 8.39 % | 1,433$ | 17,200$ |
| 3 | 10.49 % | 1,792$ | 21,500$ |
| 4 | 13.11 % | 2,240$ | 26,875$ |
| 5 | 16.39 % | 2,800$ | 33,594$ |
| 6 | 20.49 % | 3,499$ | 41,993$ |
| 7 | 25.61 % | 4,374$ | 52,491$ |
| 8 | 32.01 % | 5,468$ | 65,614$ |
| 9 | 40.01 % | 6,835$ | 82,017$ |
| 10 | 50.02 % | 8,543$ | 102,521$ |
457,566$ 223%
Total ROI For 10 Years
527$
Min Income
204,975$
Cash Price
| Year | Annual Increase | Monthly ROI | Annual ROI |
|---|---|---|---|
| 1 | 3.08 % | 527$ | 6,322$ |
| 2 | 3.86 % | 659$ | 7,903$ |
| 3 | 4.82 % | 823$ | 9,879$ |
| 4 | 6.02 % | 1,029$ | 12,348$ |
| 5 | 7.53 % | 1,286$ | 15,435$ |
| 6 | 9.41 % | 1,608$ | 19,294$ |
| 7 | 11.77 % | 2,010$ | 24,117$ |
| 8 | 14.71 % | 2,512$ | 30,147$ |
| 9 | 18.38 % | 3,140$ | 37,684$ |
| 10 | 22.98 % | 3,925$ | 47,104$ |
210,233$ 102%
Total ROI For 10 Years
District Classification
Rating
b+
Area map
Statistics
Population
381,110
Social Status
Married : 67%
Unmarried : 26%
area
230 Km2
Price Changes Over Last 5 Years
1 Year Change
17.79%
3 Year Change
202%
5 Year Change
253%
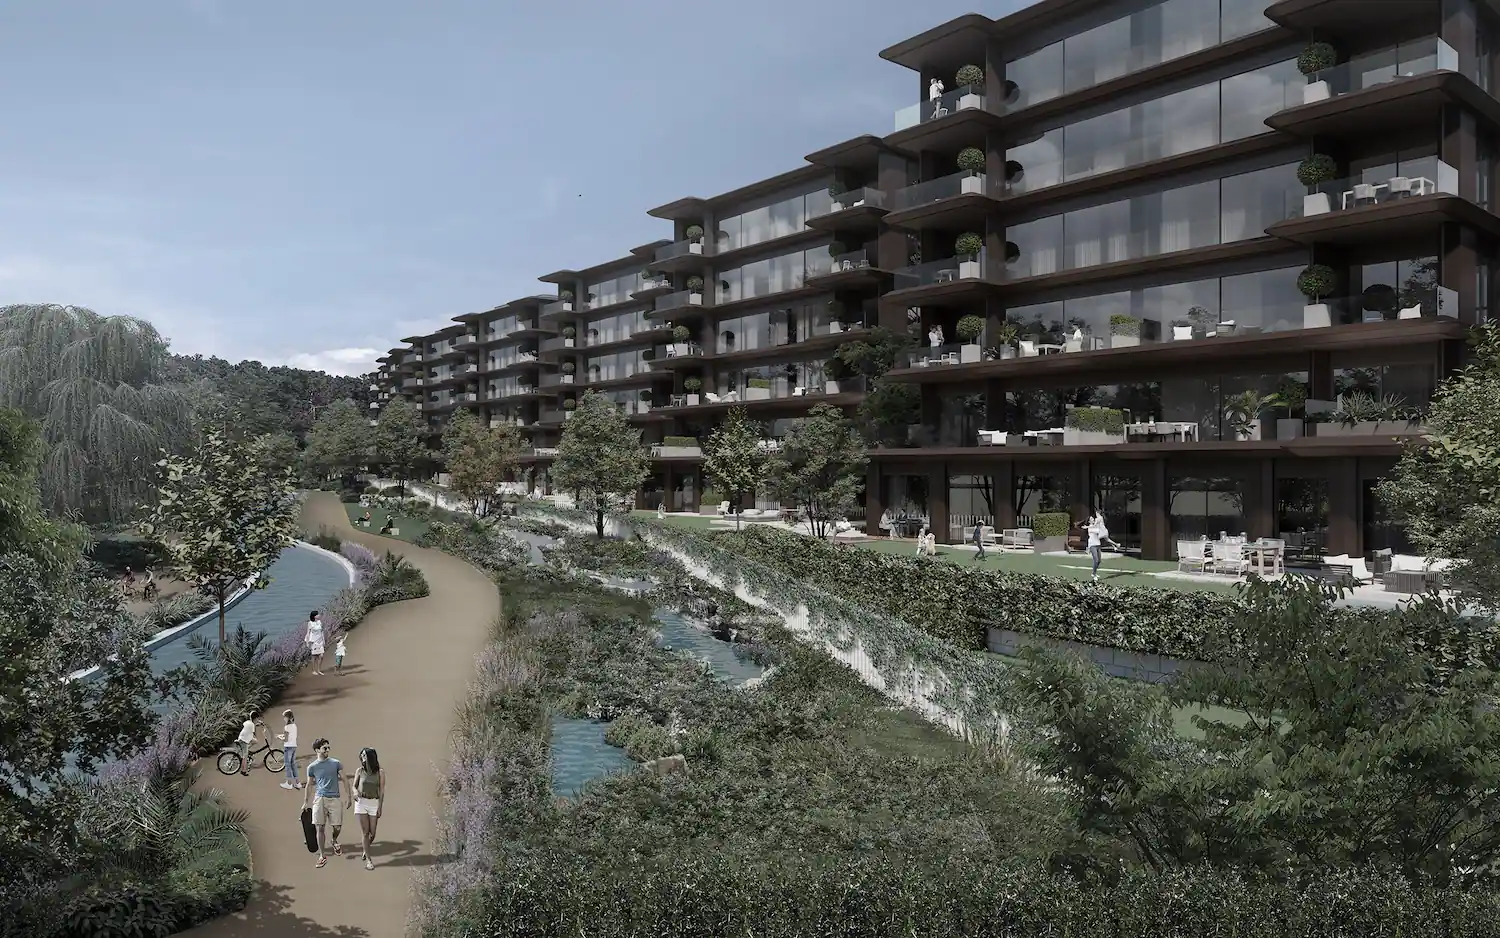
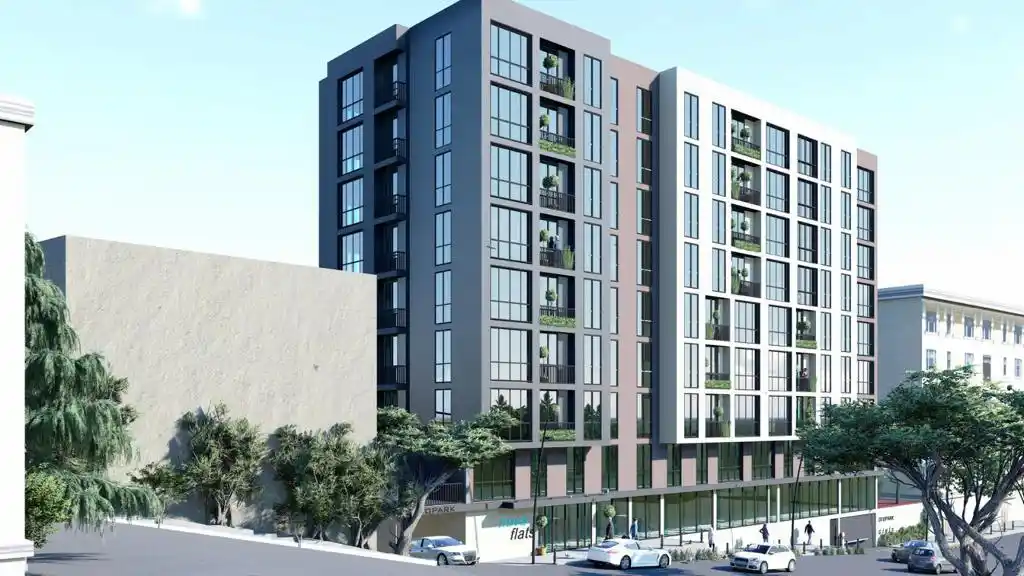
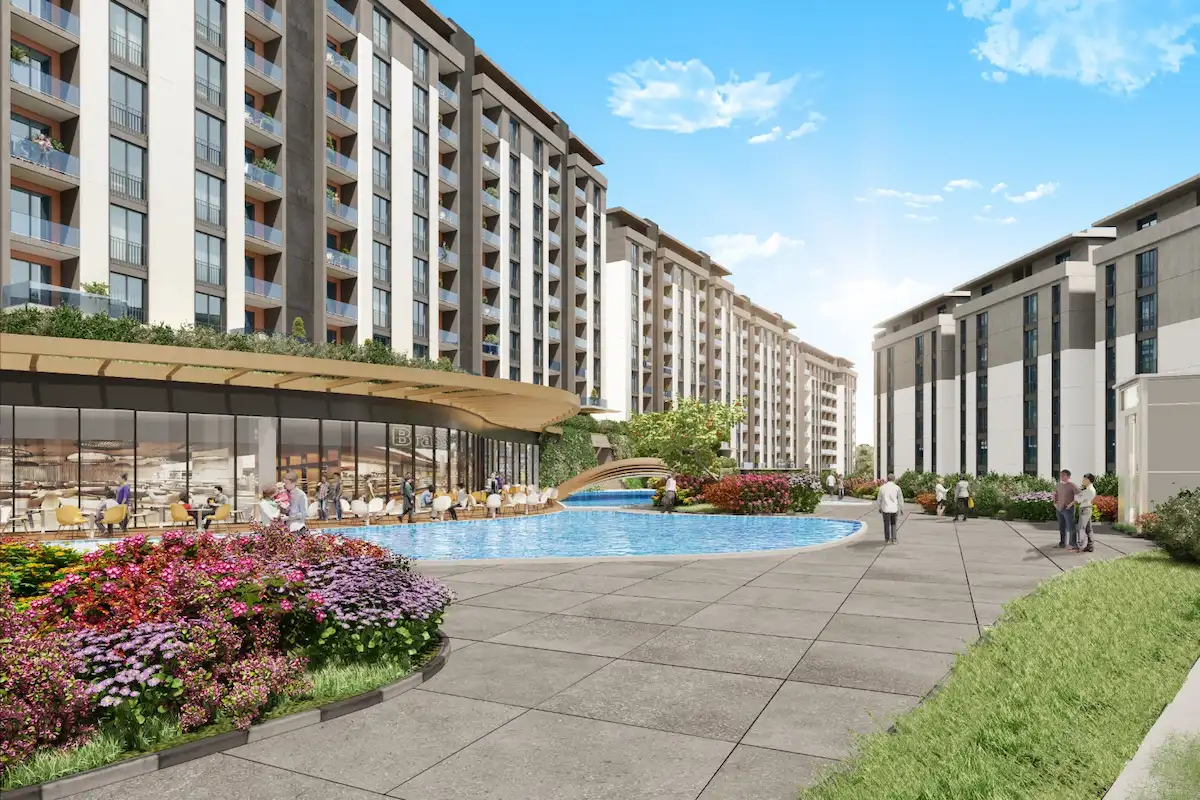
Projects Have same ROI in This Area


.webp)

Have Question Or Suggestion ?
Please Share Your Thought, To Make It Real


