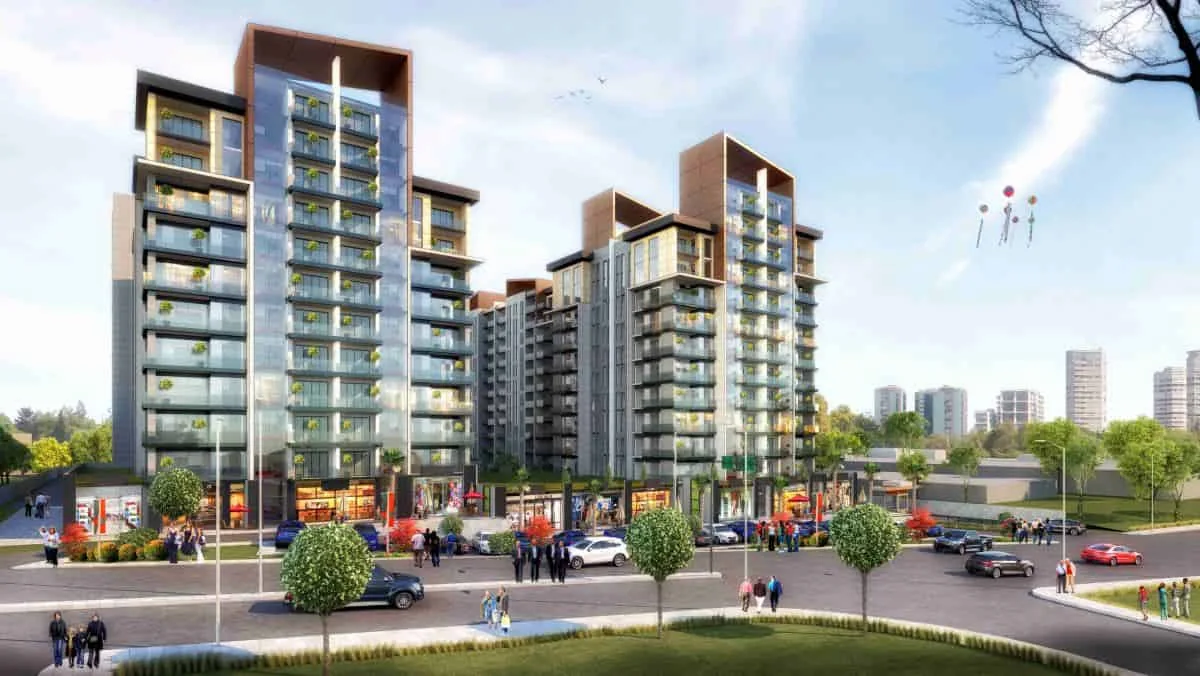
Return on Investment In Turkey
We are providing a financial metric for real estate investors as it helps them to determine the profitability of their real estate investment in Turkey
651$
Average Income
465$ - 837$
Min Income - Max Income
255,026$
Cash Price
| Year | Annual Increase | Monthly ROI | Annual ROI |
|---|---|---|---|
| 1 | 3.06 % | 651$ | 7,810$ |
| 2 | 3.83 % | 814$ | 9,762$ |
| 3 | 4.78 % | 1,017$ | 12,203$ |
| 4 | 5.98 % | 1,271$ | 15,254$ |
| 5 | 7.48 % | 1,589$ | 19,067$ |
| 6 | 9.35 % | 1,986$ | 23,834$ |
| 7 | 11.68 % | 2,483$ | 29,792$ |
| 8 | 14.60 % | 3,103$ | 37,240$ |
| 9 | 18.25 % | 3,879$ | 46,550$ |
| 10 | 22.82 % | 4,849$ | 58,188$ |
259,700$ 101%
Total ROI For 10 Years
837$
Max Income
255,026$
Cash Price
| Year | Annual Increase | Monthly ROI | Annual ROI |
|---|---|---|---|
| 1 | 3.94 % | 837$ | 10,041$ |
| 2 | 4.92 % | 1,046$ | 12,552$ |
| 3 | 6.15 % | 1,307$ | 15,689$ |
| 4 | 7.69 % | 1,634$ | 19,612$ |
| 5 | 9.61 % | 2,043$ | 24,515$ |
| 6 | 12.02 % | 2,554$ | 30,643$ |
| 7 | 15.02 % | 3,192$ | 38,304$ |
| 8 | 18.77 % | 3,990$ | 47,880$ |
| 9 | 23.47 % | 4,988$ | 59,850$ |
| 10 | 29.34 % | 6,234$ | 74,813$ |
333,899$ 130%
Total ROI For 10 Years
465$
Min Income
255,026$
Cash Price
| Year | Annual Increase | Monthly ROI | Annual ROI |
|---|---|---|---|
| 1 | 2.19 % | 465$ | 5,578$ |
| 2 | 2.73 % | 581$ | 6,973$ |
| 3 | 3.42 % | 726$ | 8,716$ |
| 4 | 4.27 % | 908$ | 10,895$ |
| 5 | 5.34 % | 1,135$ | 13,619$ |
| 6 | 6.68 % | 1,419$ | 17,024$ |
| 7 | 8.34 % | 1,773$ | 21,280$ |
| 8 | 10.43 % | 2,217$ | 26,600$ |
| 9 | 13.04 % | 2,771$ | 33,250$ |
| 10 | 16.30 % | 3,464$ | 41,563$ |
185,500$ 72%
Total ROI For 10 Years
District Classification
Rating
A-
Area map
Statistics
Population
745,125
Social Status
Married : 62%
Unmarried : 30%
area
22 Km2
Price Changes Over Last 5 Years
1 Year Change
13.59%
3 Year Change
263.6%
5 Year Change
273.2%
Projects Have same ROI in This Area
Have Question Or Suggestion ?
Please Share Your Thought, To Make It Real
.webp)



.webp)
