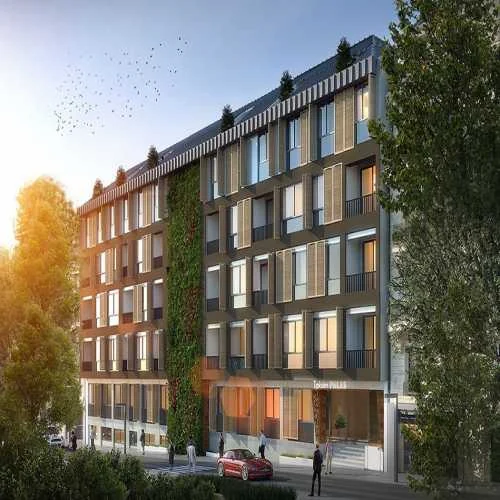
Return on Investment In Turkey
We are providing a financial metric for real estate investors as it helps them to determine the profitability of their real estate investment in Turkey
1,271$
Average Income
837$ - 1,705$
Min Income - Max Income
111,497$
Cash Price
| Year | Annual Increase | Monthly ROI | Annual ROI |
|---|---|---|---|
| 1 | 13.68 % | 1,271$ | 15,248$ |
| 2 | 17.09 % | 1,588$ | 19,060$ |
| 3 | 21.37 % | 1,985$ | 23,825$ |
| 4 | 26.71 % | 2,482$ | 29,781$ |
| 5 | 33.39 % | 3,102$ | 37,226$ |
| 6 | 41.73 % | 3,878$ | 46,532$ |
| 7 | 52.17 % | 4,847$ | 58,166$ |
| 8 | 65.21 % | 6,059$ | 72,707$ |
| 9 | 81.51 % | 7,574$ | 90,884$ |
| 10 | 101.89 % | 9,467$ | 113,605$ |
507,032$ 454%
Total ROI For 10 Years
1,705$
Max Income
111,497$
Cash Price
| Year | Annual Increase | Monthly ROI | Annual ROI |
|---|---|---|---|
| 1 | 18.35 % | 1,705$ | 20,454$ |
| 2 | 22.93 % | 2,131$ | 25,568$ |
| 3 | 28.66 % | 2,663$ | 31,960$ |
| 4 | 35.83 % | 3,329$ | 39,950$ |
| 5 | 44.79 % | 4,161$ | 49,937$ |
| 6 | 55.99 % | 5,202$ | 62,422$ |
| 7 | 69.98 % | 6,502$ | 78,027$ |
| 8 | 87.48 % | 8,128$ | 97,534$ |
| 9 | 109.35 % | 10,160$ | 121,917$ |
| 10 | 136.68 % | 12,700$ | 152,397$ |
680,165$ 610%
Total ROI For 10 Years
837$
Min Income
111,497$
Cash Price
| Year | Annual Increase | Monthly ROI | Annual ROI |
|---|---|---|---|
| 1 | 9.01 % | 837$ | 10,041$ |
| 2 | 11.26 % | 1,046$ | 12,552$ |
| 3 | 14.07 % | 1,307$ | 15,689$ |
| 4 | 17.59 % | 1,634$ | 19,612$ |
| 5 | 21.99 % | 2,043$ | 24,515$ |
| 6 | 27.48 % | 2,554$ | 30,643$ |
| 7 | 34.35 % | 3,192$ | 38,304$ |
| 8 | 42.94 % | 3,990$ | 47,880$ |
| 9 | 53.68 % | 4,988$ | 59,850$ |
| 10 | 67.10 % | 6,234$ | 74,813$ |
333,899$ 299%
Total ROI For 10 Years
District Classification
Rating
a+
Area map
Statistics
Population
274,200
Social Status
Married : 49%
Unmarried : 35%
area
10 Km2
Price Changes Over Last 5 Years
1 Year Change
17.69%
3 Year Change
277.4%
5 Year Change
284%
Projects Have same ROI in This Area
Have Question Or Suggestion ?
Please Share Your Thought, To Make It Real



.webp)
